# Activity Analysis
Activity Analysis lets you map business activities, allocate effort across positions, and analyze how time is spent across your organization.
## Accessing Activity Analysis
Navigate to your scenario > click the org chart icon next to it > select **Activity Analysis**.
## Mapping Business Processes and Activities
1. Hover over the root node and click **+** to add Level 1 business processes (e.g., Sales, Finance, Product)
2. Hover over a business process and click **+** to add activities beneath it (e.g., Offline Sales and Conferences under Sales)
## Assigning Roles and Effort
1. Hover over an activity and click the **Positions** icon to assign positions to it
2. Set a time percentage allocation for each position
3. Confirm allocations to track effort distribution
## Categorizing Activities
Click on an activity box to assign it a category indicating its business impact:
* **Value Add** — Directly contributes to business goals
* **Non-Value Add** — Not directly beneficial but still requires effort
## Navigating Activity Maps
1. Use the left-hand panel to move between activities and expand activity trees
2. Click on any activity to drill down further or edit details.
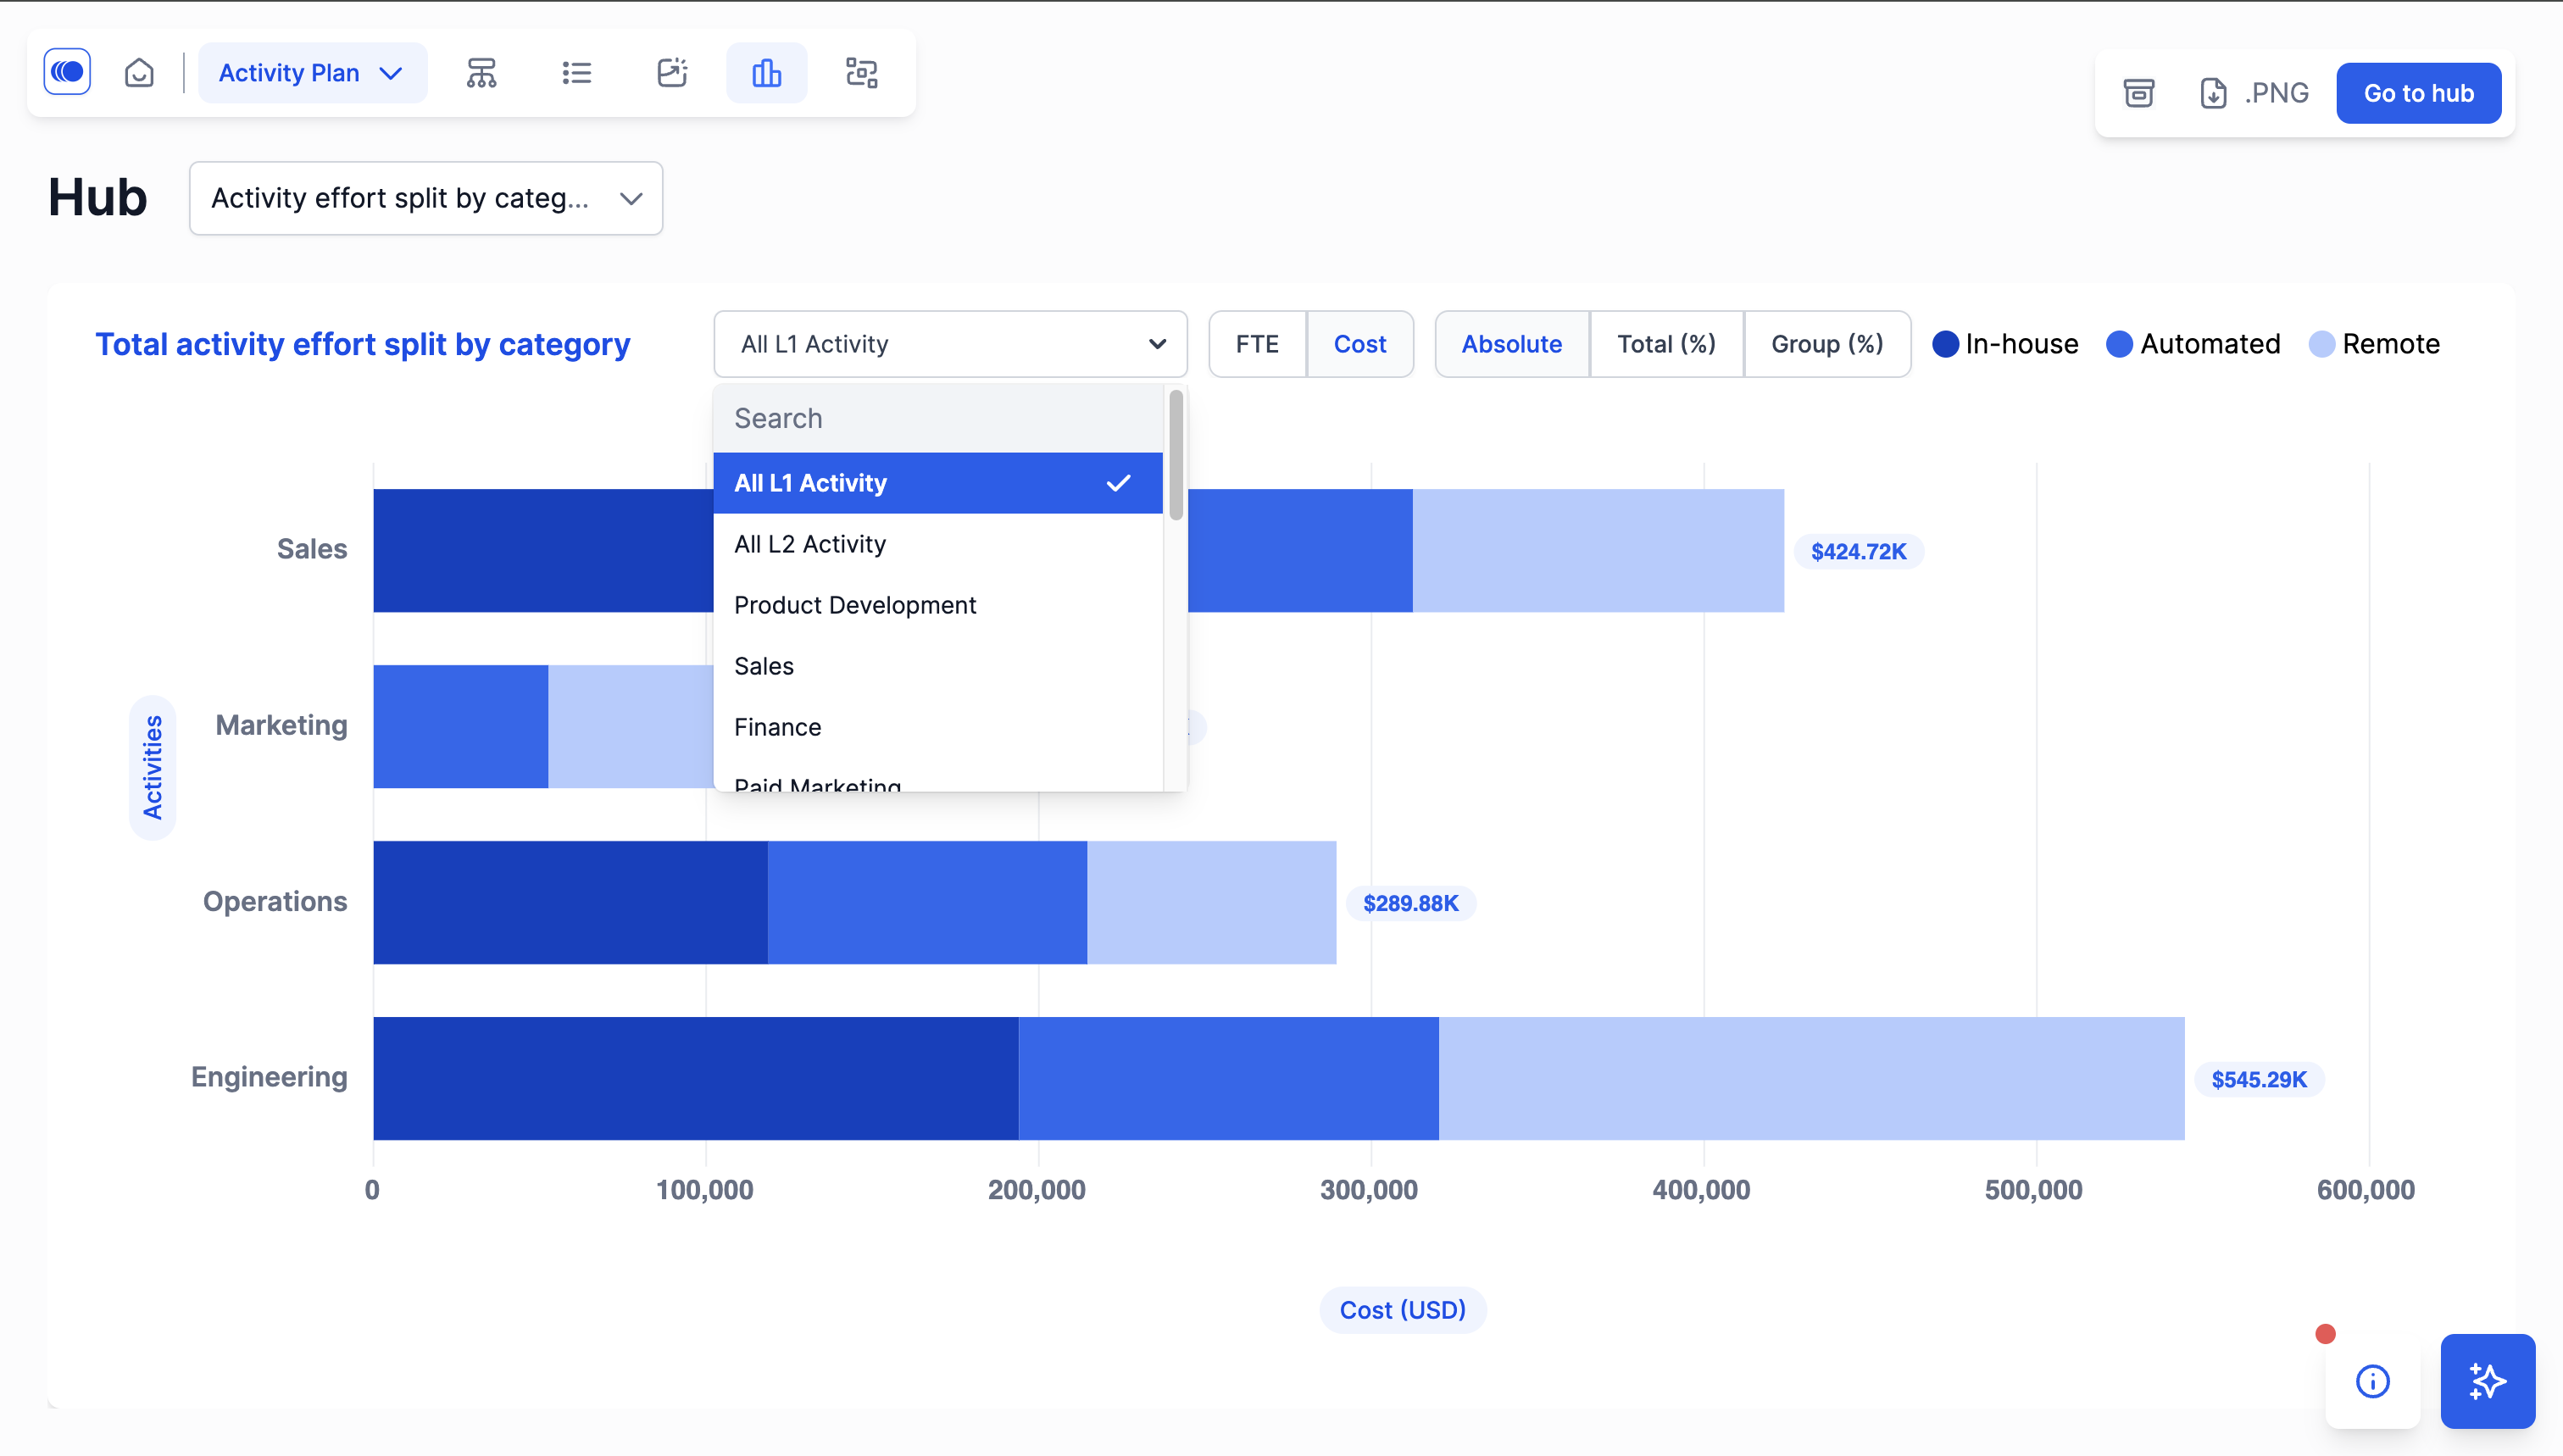
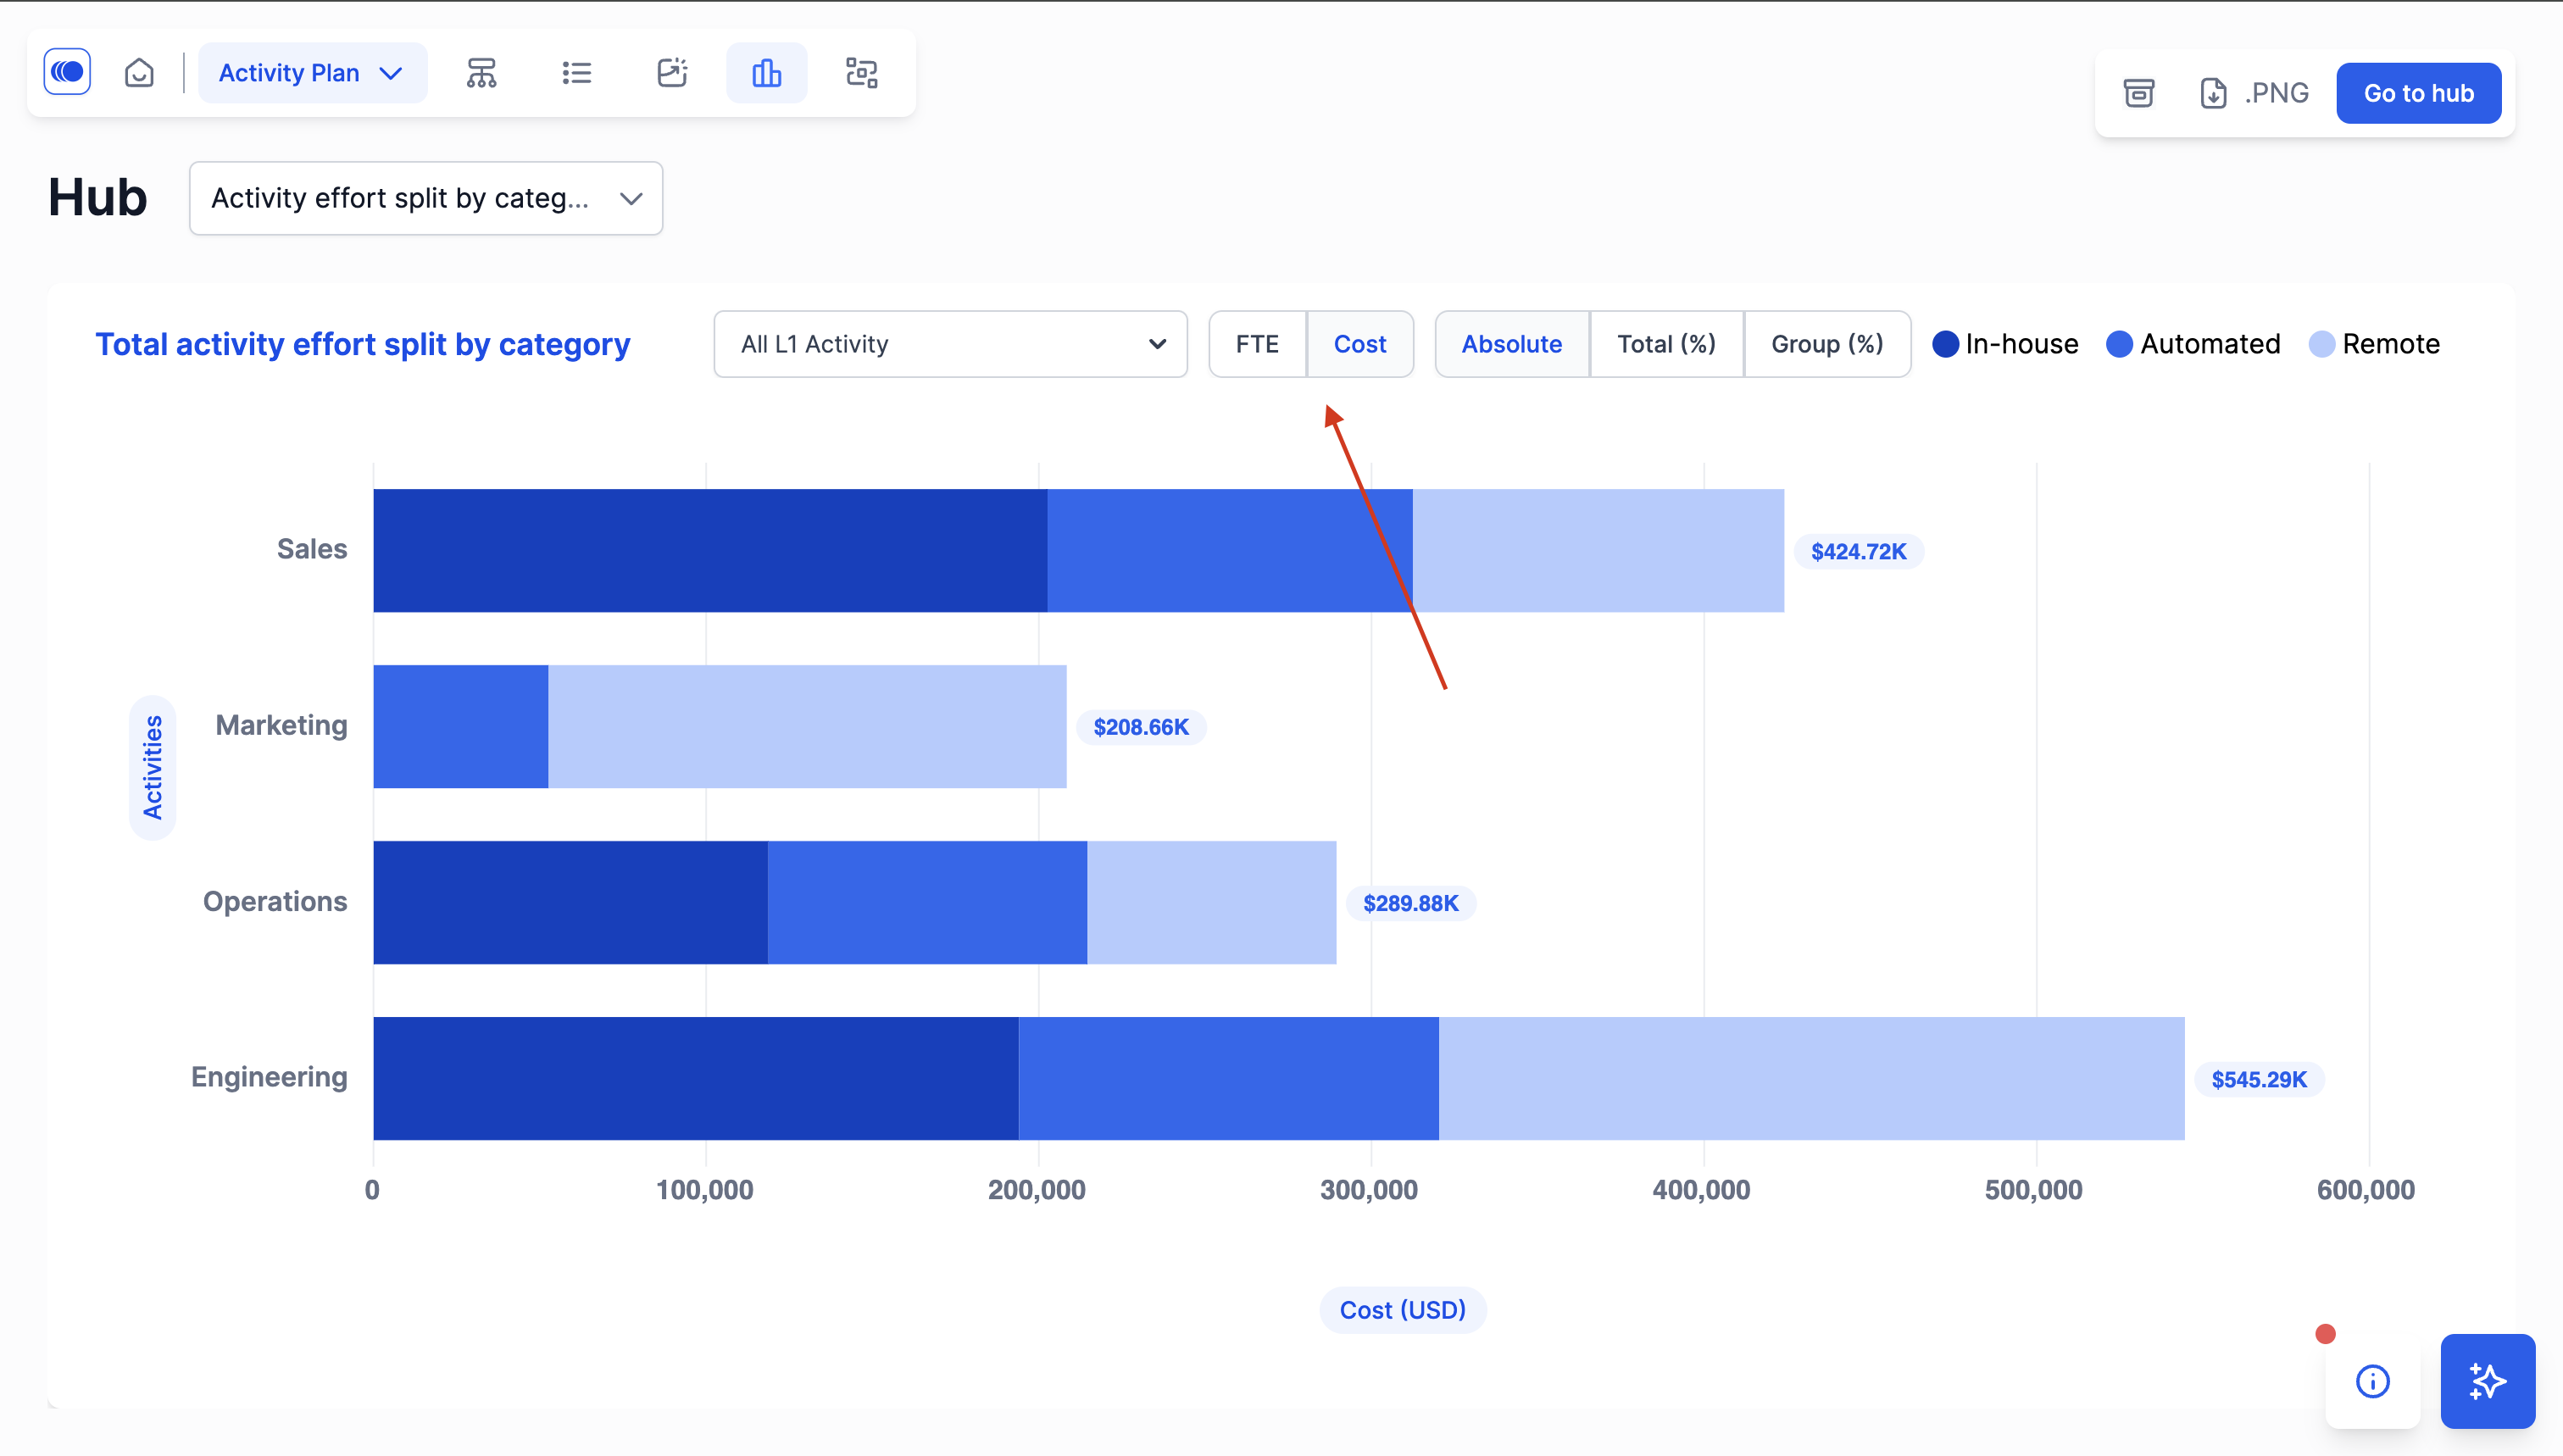
## Analyzing Activity Effort Split by Category
1. Open **Workforce Hub** and navigate to the **Activity Split by Category** chart to visualize your operating model by category. Analyze data through three perspectives:
2. Analyze data through different perspectives:
* **Effort Split by Activity Level** — Use the filter dropdown to select the activity levels you want to visualize
* **FTE Count or Cost** — Assess effort based on full-time equivalent allocation or salary cost. Hover over bars to see FTE count or cost details for each activity.

* **Percentage Distribution** — Visualize workload distribution across functions as Absolute, Total %, or Group %
---
# Agent Instructions: Querying This Documentation
If you need additional information that is not directly available in this page, you can query the documentation dynamically by asking a question.
Perform an HTTP GET request on the current page URL with the `ask` query parameter:
```
GET https://docs.agentnoon.com/activity-analysis/activity-analysis.md?ask=
```
The question should be specific, self-contained, and written in natural language.
The response will contain a direct answer to the question and relevant excerpts and sources from the documentation.
Use this mechanism when the answer is not explicitly present in the current page, you need clarification or additional context, or you want to retrieve related documentation sections.