# Agentnoon Help Center

Guides and best practices to help your team get started and move forward with confidence.

### Get Started

<table data-view="cards"><thead><tr><th></th><th></th><th data-hidden data-card-cover data-type="files"></th><th data-hidden></th><th data-hidden data-card-target data-type="content-ref"></th></tr></thead><tbody><tr><td><strong>Start Here</strong></td><td>Get started with Agentnoon</td><td><a href="https://2094208261-files.gitbook.io/~/files/v0/b/gitbook-x-prod.appspot.com/o/spaces%2FCZc46qaaBbVmMuYXPfgz%2Fuploads%2Fgit-blob-9d8d0bee8e6151a24c25e67d652b96ed4de18526%2FData-import%20(1).png?alt=media">Data-import (1).png</a></td><td></td><td><a href="/start-here/overview">Platform Overview</a></td></tr><tr><td><strong>Main Org</strong></td><td>Navigate your current organization</td><td><a href="https://2094208261-files.gitbook.io/~/files/v0/b/gitbook-x-prod.appspot.com/o/spaces%2FCZc46qaaBbVmMuYXPfgz%2Fuploads%2Fgit-blob-9978df29980e3f9104885b985ff57d786d6a34f4%2FOrg%20chart.png?alt=media">Org chart.png</a></td><td></td><td><a href="/main-org/overview">Main Org Overview</a></td></tr><tr><td><strong>Scenarios</strong></td><td>Plan the future</td><td><a href="https://2094208261-files.gitbook.io/~/files/v0/b/gitbook-x-prod.appspot.com/o/spaces%2FCZc46qaaBbVmMuYXPfgz%2Fuploads%2Fgit-blob-8198187e0c119fbdc91b59d147ccf96f42713056%2FScenarios.png?alt=media">Scenarios.png</a></td><td></td><td><a href="/scenarios/overview">Scenarios Overview</a></td></tr><tr><td><strong>Forecast</strong></td><td>Manage headcount and budget</td><td><a href="https://2094208261-files.gitbook.io/~/files/v0/b/gitbook-x-prod.appspot.com/o/spaces%2FCZc46qaaBbVmMuYXPfgz%2Fuploads%2Fgit-blob-11ff76f5f3fefa05c7f4cfa9efa7207597acf0ac%2FForecast.png?alt=media">Forecast.png</a></td><td></td><td><a href="/forecast/overview">Forecast Overview</a></td></tr><tr><td><strong>Workforce Hub</strong></td><td>Explore analytics</td><td><a href="https://2094208261-files.gitbook.io/~/files/v0/b/gitbook-x-prod.appspot.com/o/spaces%2FCZc46qaaBbVmMuYXPfgz%2Fuploads%2Fgit-blob-df79e8443772f92bac93caa1a27d345352c7da8b%2Fhub.png?alt=media">hub.png</a></td><td></td><td><a href="/hub/overview">Workforce Hub Overview</a></td></tr><tr><td><strong>Directory</strong></td><td>View and manage data</td><td><a href="https://2094208261-files.gitbook.io/~/files/v0/b/gitbook-x-prod.appspot.com/o/spaces%2FCZc46qaaBbVmMuYXPfgz%2Fuploads%2Fgit-blob-62cad8cb326449874af2754978f64fa5cbf51f73%2FAccess%20control.png?alt=media">Access control.png</a></td><td></td><td><a href="/directory/overview">Directory Overview</a></td></tr><tr><td><strong>Admin Capabilities</strong></td><td>Configure and manage</td><td><a href="https://2094208261-files.gitbook.io/~/files/v0/b/gitbook-x-prod.appspot.com/o/spaces%2FCZc46qaaBbVmMuYXPfgz%2Fuploads%2Fgit-blob-6277837db33dc8f6690ffc338606442e2dce5391%2FSettings.png?alt=media">Settings.png</a></td><td></td><td><a href="/admin-capabilities/overview">Admin Overview</a></td></tr><tr><td><strong>Use Case Tutorials</strong></td><td>Learn by doing</td><td><a href="https://2094208261-files.gitbook.io/~/files/v0/b/gitbook-x-prod.appspot.com/o/spaces%2FCZc46qaaBbVmMuYXPfgz%2Fuploads%2Fgit-blob-fe7fd6ba52cbaa3bb9b4e99ef561632a8ba6bc42%2FApprovals.png?alt=media">Approvals.png</a></td><td></td><td><a href="/reference-guides/overview/planning-reorganization">Planning a Reorganization</a></td></tr></tbody></table>


# Quick Start Guide

Get productive in your first 30 minutes.

This guide walks you through the core workflows in Agentnoon. By the end, you’ll know how to:

* Explore your current organization
* Model changes in a scenario
* See headcount and cost impact over time
* Export insights for stakeholders

### 1. Log In and Open Your Organization

1. Go to app.agentnoon.com and log in with your credentials
2. You'll land on the **Homepage** with:
   * Your instance name at the top
   * A list of Scenarios in the main panel (this may be empty initially)
   * Quick links to documentation and support
3. Click **Open Org Chart** to see your current organization

You are now in **Main Org**, where you can begin exploring your organizational structure.

<figure><img src="https://2094208261-files.gitbook.io/~/files/v0/b/gitbook-x-prod.appspot.com/o/spaces%2FCZc46qaaBbVmMuYXPfgz%2Fuploads%2FbuC5at7iEoAxnNN4Kfit%2FScreenshot%202026-02-24%20at%202.08.16%E2%80%AFPM.png?alt=media&amp;token=96e77cf3-cc2b-4f41-ad31-9dd4137ad575" alt=""><figcaption></figcaption></figure>

### 2. Explore the Main Organization

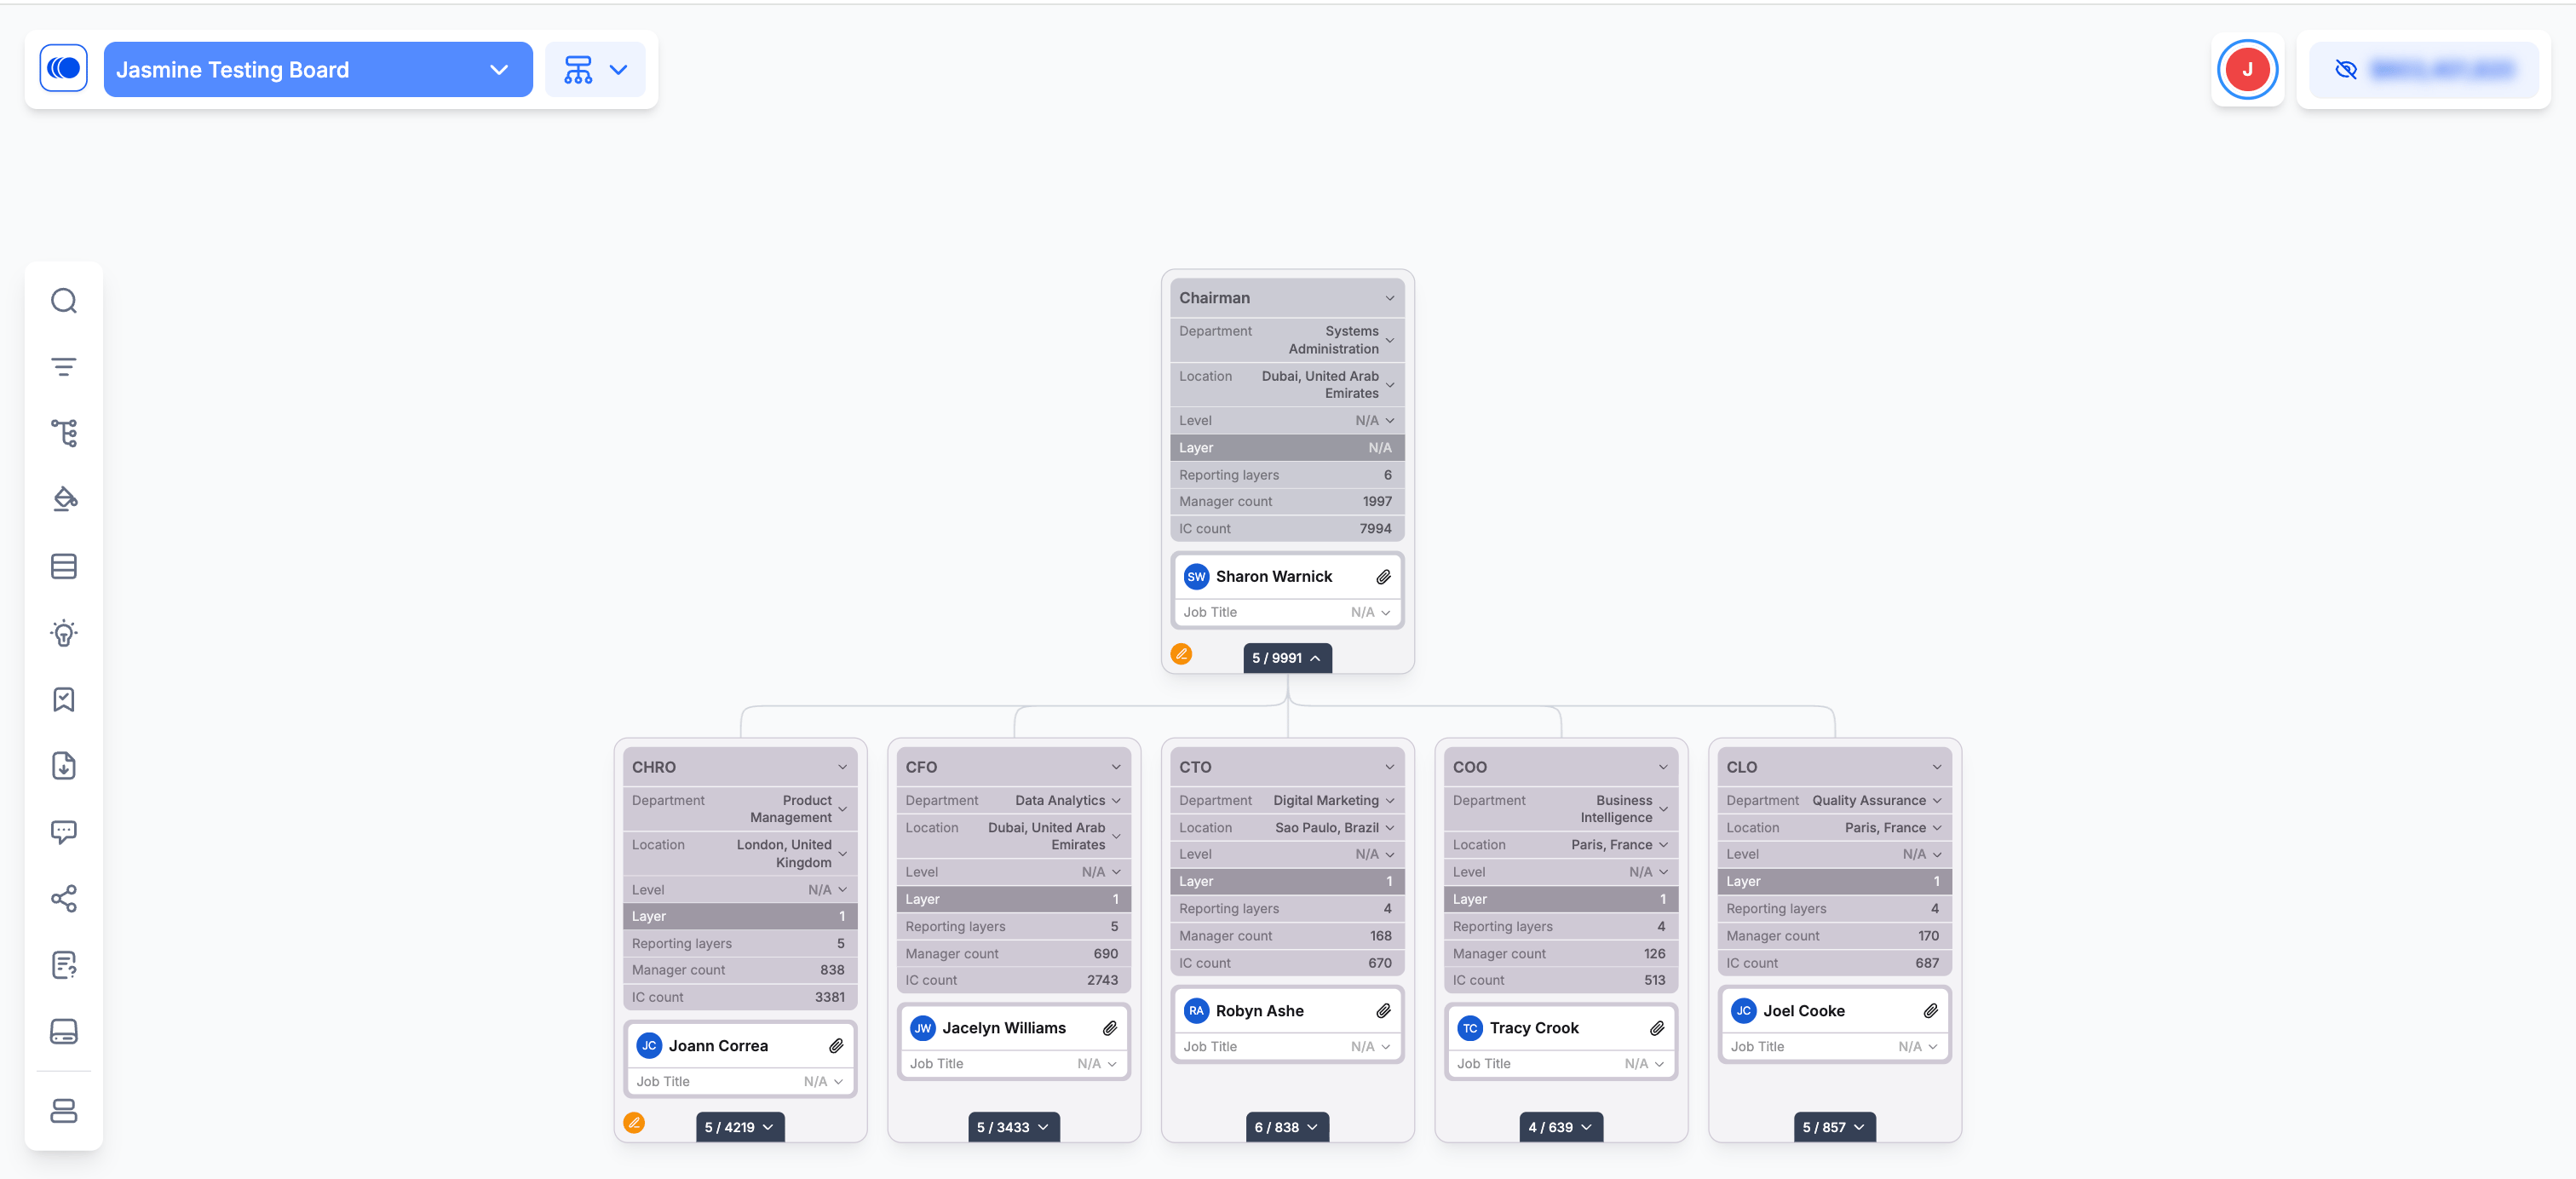
In **Main Org**, positions appear as cards arranged in a hierarchy.

To navigate:

1. Hover over a card to see quick details.
2. Click the expand or collapse arrows to show or hide reporting lines.
3. Scroll and zoom to explore different areas of the org.

Take a few minutes to move around and familiarize yourself with the structure.

<figure><img src="https://2094208261-files.gitbook.io/~/files/v0/b/gitbook-x-prod.appspot.com/o/spaces%2FCZc46qaaBbVmMuYXPfgz%2Fuploads%2FzvMbAvzfqJR0Tgg8aRNC%2FScreenshot%202026-02-24%20at%201.02.21%E2%80%AFPM.png?alt=media&amp;token=8fec5545-bd32-4695-8bcc-b8766355d8c0" alt=""><figcaption></figcaption></figure>

### 3. Search for a Person or Position

Use the search bar to find any person or position:

1. Start typing a name, job title, or unique ID (i.e., employee ID or position ID) — results appear as you type.
2. Click a result to navigate directly to that person or position in the org chart.

### 4. Add Card Content

You can control which fields are visible on each card:

1. Click the **Card Content** button in the toolbar.
2. Select which fields to display (for example, work city, department, salary, etc.).
3. Check or uncheck fields to add or remove them.
4. Cards update immediately to reflect your selections.

:bulb: You can also include calculated (FX) fields, such as **Total Span of Control**, to surface additional insight directly in the org chart.

<figure><img src="https://2094208261-files.gitbook.io/~/files/v0/b/gitbook-x-prod.appspot.com/o/spaces%2FCZc46qaaBbVmMuYXPfgz%2Fuploads%2FnsSFPXfRGuSdcm2at5dX%2FScreenshot%202026-02-24%20at%201.06.53%E2%80%AFPM.png?alt=media&amp;token=fb6c4100-f602-419b-bc59-b4b8750344de" alt=""><figcaption></figcaption></figure>

### 5. Create and Save a Custom View

Use **Highlight** and **Filter** to focus on specific teams or attributes.

**Apply Highlighting:**

1. Click **Highlight** in the toolbar.
2. Choose a field (for example, Work Country or Department).
3. Cards will automatically color-code by value

<figure><img src="https://2094208261-files.gitbook.io/~/files/v0/b/gitbook-x-prod.appspot.com/o/spaces%2FCZc46qaaBbVmMuYXPfgz%2Fuploads%2FrkF80EaQPDKw0XpAj7Qy%2FScreenshot%202026-02-24%20at%201.38.23%E2%80%AFPM.png?alt=media&amp;token=2c234145-5587-44bd-9348-24f364502478" alt=""><figcaption></figcaption></figure>

**Apply Filters:**

1. Click **Filter** in the toolbar.
2. Select criteria (for example, Department, Location, etc.)
3. Check **preserve manager relationships** to maintain reporting context.
4. Click **Apply.**

<figure><img src="https://2094208261-files.gitbook.io/~/files/v0/b/gitbook-x-prod.appspot.com/o/spaces%2FCZc46qaaBbVmMuYXPfgz%2Fuploads%2FPqvZC4qPEYYQJGYa9Mbz%2FScreenshot%202026-02-24%20at%201.44.32%E2%80%AFPM.png?alt=media&amp;token=a369cb2f-d128-4f03-869f-92f963e68b5b" alt=""><figcaption></figcaption></figure>

**Save Your View:**

1. After applying highlights and filters, click **Views** in the toolbar.
2. Select **Save Current View**
3. Enter a name (for example, “Engineering Team” or “US Employees").
4. Your saved view will appear in the Views dropdown for quick access later.

<figure><img src="https://2094208261-files.gitbook.io/~/files/v0/b/gitbook-x-prod.appspot.com/o/spaces%2FCZc46qaaBbVmMuYXPfgz%2Fuploads%2F0iEJXtPwctA0glEWCGIv%2FScreenshot%202026-02-24%20at%202.28.32%E2%80%AFPM.png?alt=media&amp;token=c156fe1f-b081-48bd-bb0a-138a0eb64037" alt=""><figcaption></figcaption></figure>

<figure><img src="https://2094208261-files.gitbook.io/~/files/v0/b/gitbook-x-prod.appspot.com/o/spaces%2FCZc46qaaBbVmMuYXPfgz%2Fuploads%2FOjuZlqfxbN3OkXupjKBD%2FScreenshot%202026-02-24%20at%202.29.09%E2%80%AFPM.png?alt=media&amp;token=fce9aeb9-fbd0-4571-82b1-644fec84ab5b" alt=""><figcaption></figcaption></figure>

### 6. Use Spotlight to Find Patterns

Spotlight highlights positions that match selected rules, helping you quickly spot patterns across the organization.

1. Click **Spotlight** in the toolbar.
2. Choose from pre-configured rules:
   * Average span of control ranges
   * Specific pay grades
   * Custom field values
3. Positions that match will highlight automatically.
4. Review the list of matching positions to investigate further.

### 7. Create Your First Scenario

Scenarios let you model changes before implementing them:

1. Return to the **Homepage**.
2. Click **+ Create Scenario**.
3. Choose a scenario type:
   * **Full Org** - Includes everyone in your scope
   * **Partial Org** - Select specific departments or teams
   * **New Org** - Start from blank canvas

<figure><img src="https://2094208261-files.gitbook.io/~/files/v0/b/gitbook-x-prod.appspot.com/o/spaces%2FCZc46qaaBbVmMuYXPfgz%2Fuploads%2FFGh2DjLXT1feEyVQtgHC%2FScreenshot%202026-02-24%20at%201.24.21%E2%80%AFPM.png?alt=media&amp;token=fd660cdc-688f-4265-a4fb-4e8a9d07ea4e" alt=""><figcaption></figcaption></figure>

4. Enter a clear name (for example, “Q2 Hiring Plan”).
5. Set a budget (optional).
6. Click **Create**

You’re now working in an editable version of your organization where you can begin modeling changes.

<figure><img src="https://2094208261-files.gitbook.io/~/files/v0/b/gitbook-x-prod.appspot.com/o/spaces%2FCZc46qaaBbVmMuYXPfgz%2Fuploads%2FsNcD1IFoNSCj8SryAFL6%2FScreenshot%202026-02-24%20at%201.25.20%E2%80%AFPM.png?alt=media&amp;token=8e071409-99a6-40f5-9585-75df1c161705" alt=""><figcaption></figcaption></figure>

### 8. Make Position Changes in a Scenario

Once inside a scenario, you can begin modeling changes.

**Add a position**

1. Hover over a card.
2. click the **+** button.
3. Enter the position details and save.

<figure><img src="https://2094208261-files.gitbook.io/~/files/v0/b/gitbook-x-prod.appspot.com/o/spaces%2FCZc46qaaBbVmMuYXPfgz%2Fuploads%2F1iaKrTAs9uGcwatqGcRC%2FScreenshot%202026-02-24%20at%203.57.01%E2%80%AFPM.png?alt=media&amp;token=5657726a-c0e3-4a8d-bd20-d43627614052" alt=""><figcaption></figcaption></figure>

**Edit a position**

1. Click the card.
2. Modify fields in the side panel and save.

<figure><img src="https://2094208261-files.gitbook.io/~/files/v0/b/gitbook-x-prod.appspot.com/o/spaces%2FCZc46qaaBbVmMuYXPfgz%2Fuploads%2Fzvfp9VS6I319yokT8RPW%2FScreenshot%202026-02-24%20at%204.00.31%E2%80%AFPM.png?alt=media&amp;token=979756e7-345d-4d96-8b5a-7ed7aeeb8d8c" alt=""><figcaption></figcaption></figure>

**Move a position**

1. Drag and drop a card to a new manager.

**Move a team**

1. Select the manager's card.
2. Click **Change Manager.**
3. Choose a new manager to move the entire team.

**Close a position**

1. Click the card.
2. Select **Close Position** from the menu.

<figure><img src="https://2094208261-files.gitbook.io/~/files/v0/b/gitbook-x-prod.appspot.com/o/spaces%2FCZc46qaaBbVmMuYXPfgz%2Fuploads%2FaB9TDFWNc6x1T82l5a7L%2FScreenshot%202026-02-24%20at%204.03.19%E2%80%AFPM.png?alt=media&amp;token=381fd38e-d0f4-4a6c-894d-8473a1ea676e" alt=""><figcaption></figcaption></figure>

**Bulk edit positions**

1. Select three or more positions.
2. Click **Edit**.
3. Modify shared fields and save changes to all.

<figure><img src="https://2094208261-files.gitbook.io/~/files/v0/b/gitbook-x-prod.appspot.com/o/spaces%2FCZc46qaaBbVmMuYXPfgz%2Fuploads%2FQAXTq8MXxinVM9gPdLtK%2FScreenshot%202026-02-24%20at%204.08.05%E2%80%AFPM.png?alt=media&amp;token=fd6d8064-310f-428d-a354-eb6aad7d18b0" alt=""><figcaption></figcaption></figure>

4. **Move a team:** Select a manager's card > click **Change Manager** > choose new manager > entire team moves

<figure><img src="https://2094208261-files.gitbook.io/~/files/v0/b/gitbook-x-prod.appspot.com/o/spaces%2FCZc46qaaBbVmMuYXPfgz%2Fuploads%2FAAXBsYMPz4xOysnZqek5%2FScreenshot%202026-02-24%20at%204.58.33%E2%80%AFPM.png?alt=media&amp;token=d935090b-804b-48a9-9975-1772c929dc03" alt=""><figcaption></figcaption></figure>

### 9. View Changes in Forecast

Forecast shows the projected impact of your scenario so you can easily see how changes affect headcount and cost over time.&#x20;

1. Click the **View switcher** and select **Forecast**.

   The timeline shows your scenario’s projected headcount or cost by month.\
   Changes appear based on their effective dates.
2. Toggle between **Headcount** and **Cost** metrics.

   Hover over any point on the timeline to see a detailed breakdown.

<figure><img src="https://2094208261-files.gitbook.io/~/files/v0/b/gitbook-x-prod.appspot.com/o/spaces%2FCZc46qaaBbVmMuYXPfgz%2Fuploads%2F57QwEUA6y1daGidVcC9C%2FScreenshot%202026-02-26%20at%209.04.29%E2%80%AFAM.png?alt=media&amp;token=5b3ded69-b54f-4ebc-8997-704037a46584" alt=""><figcaption></figcaption></figure>

### 10. Export a Chart to PowerPoint

Export charts directly from Agentnoon to share your analysis with stakeholders:

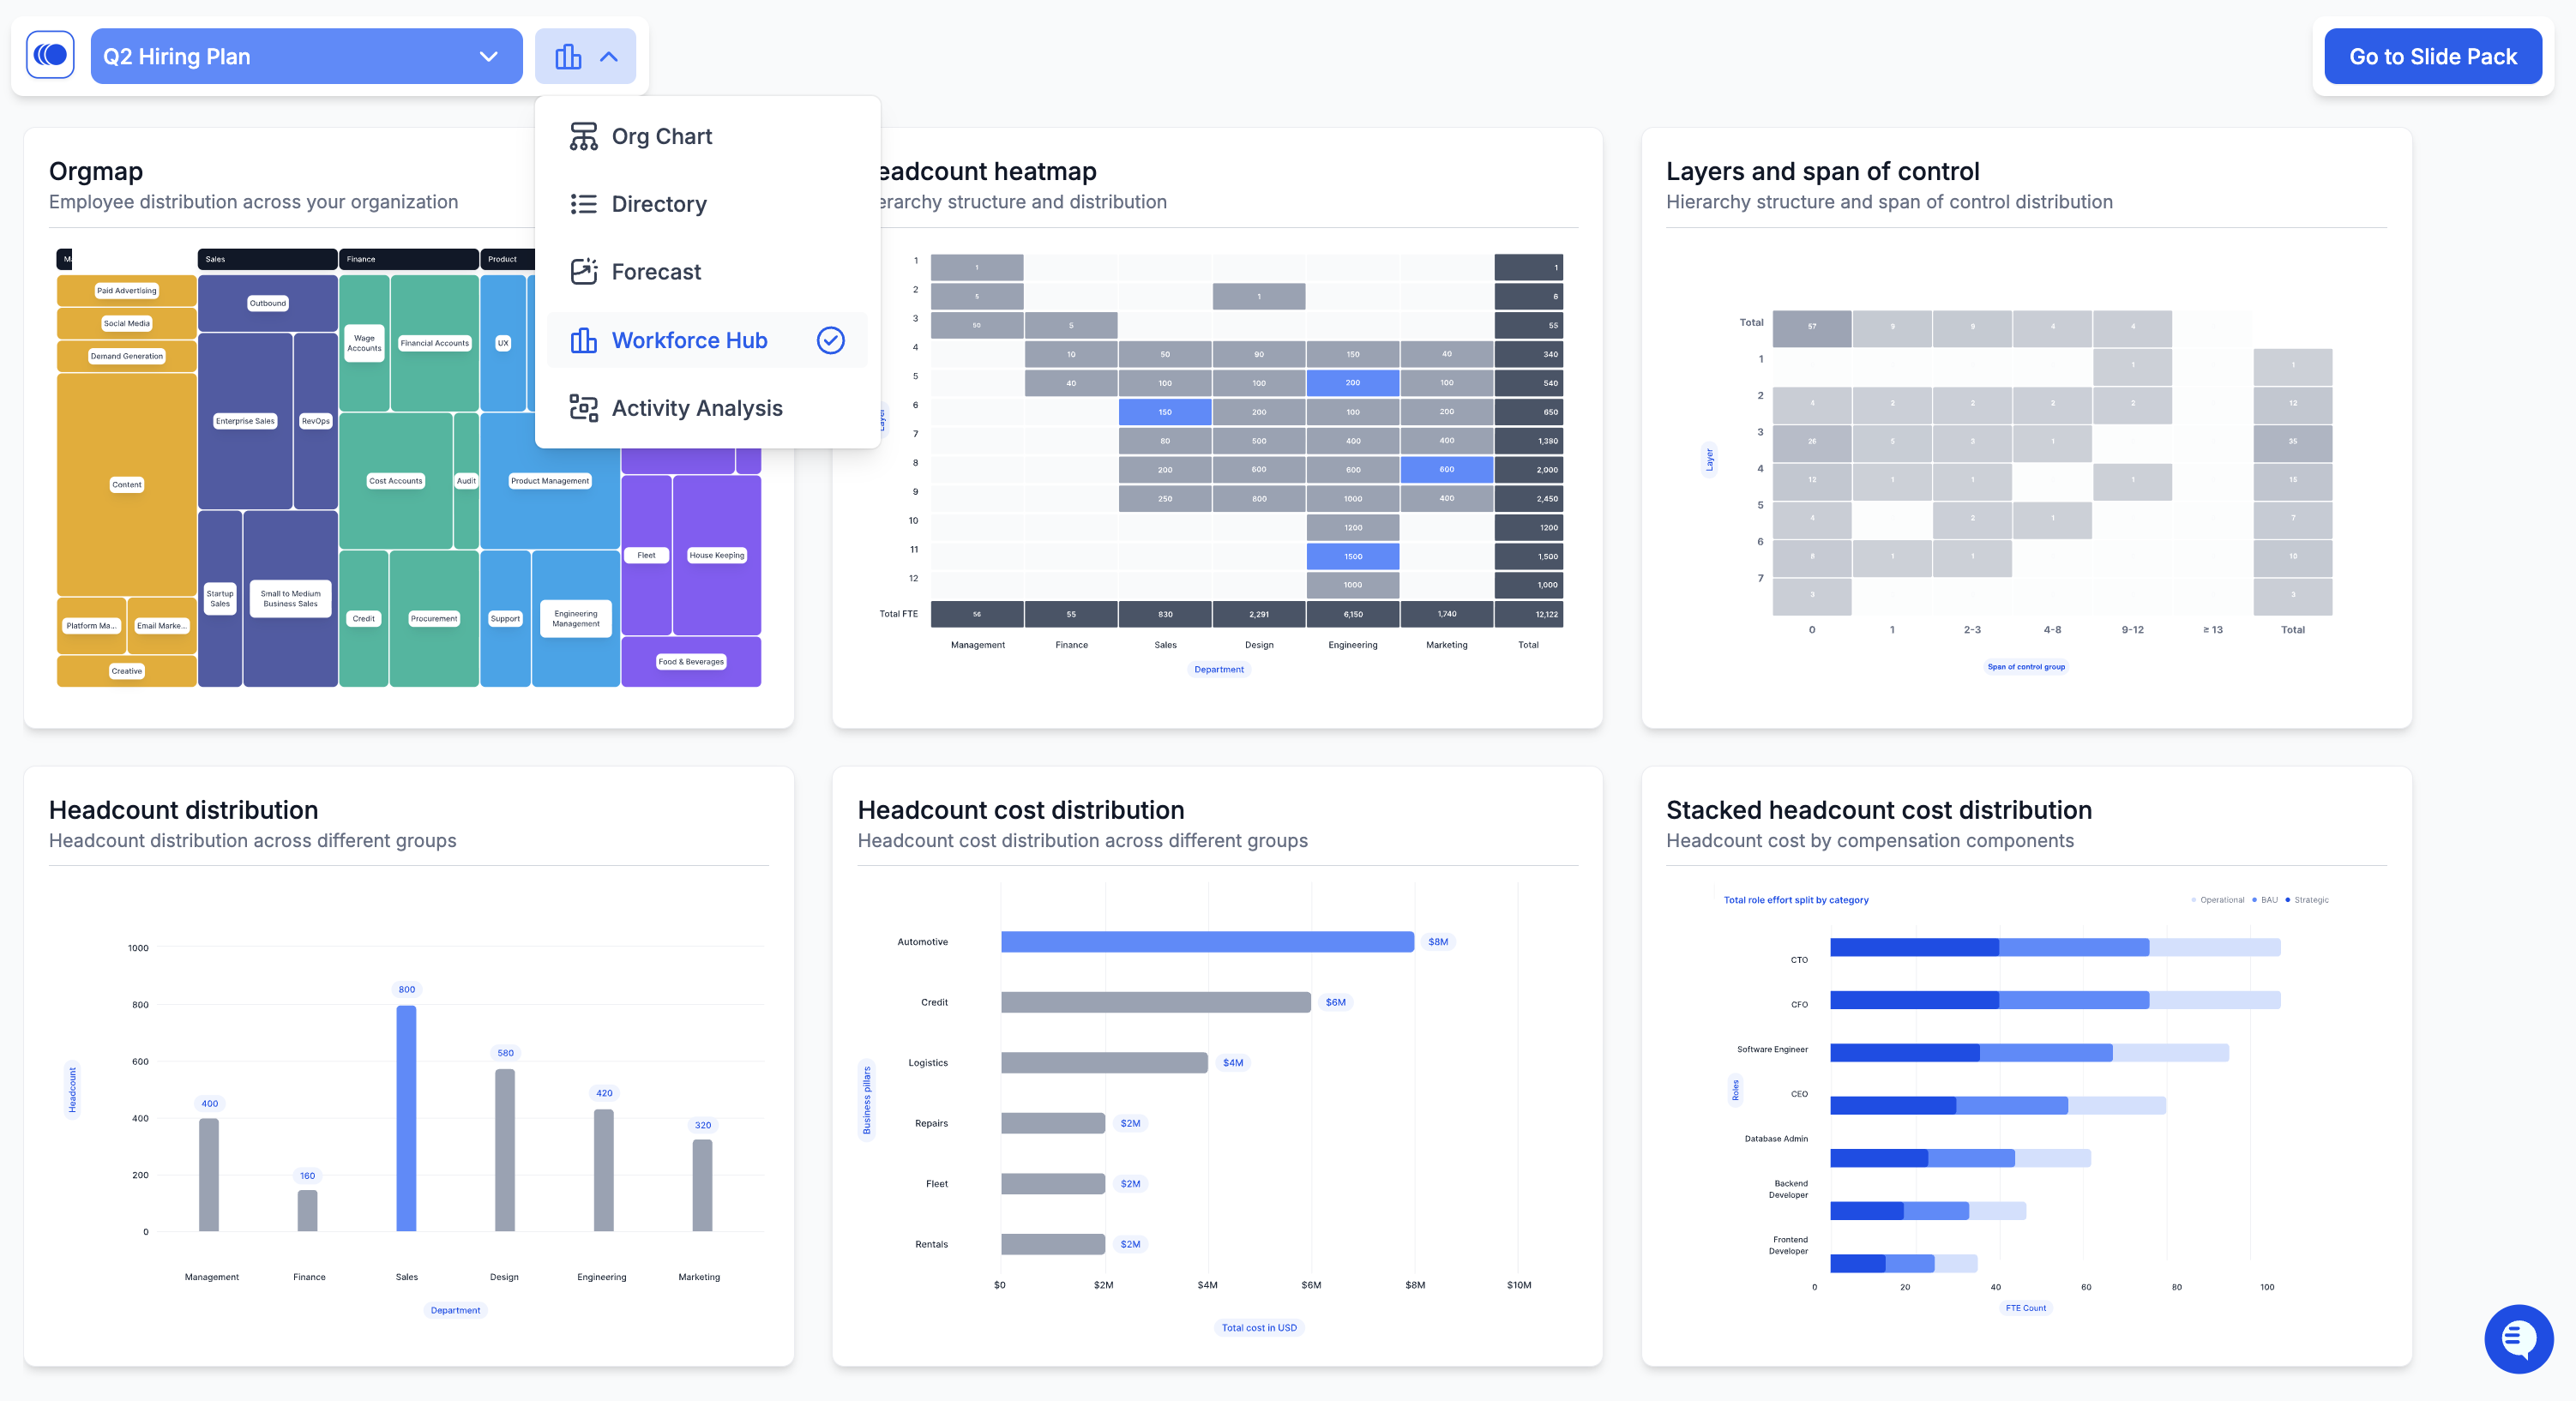
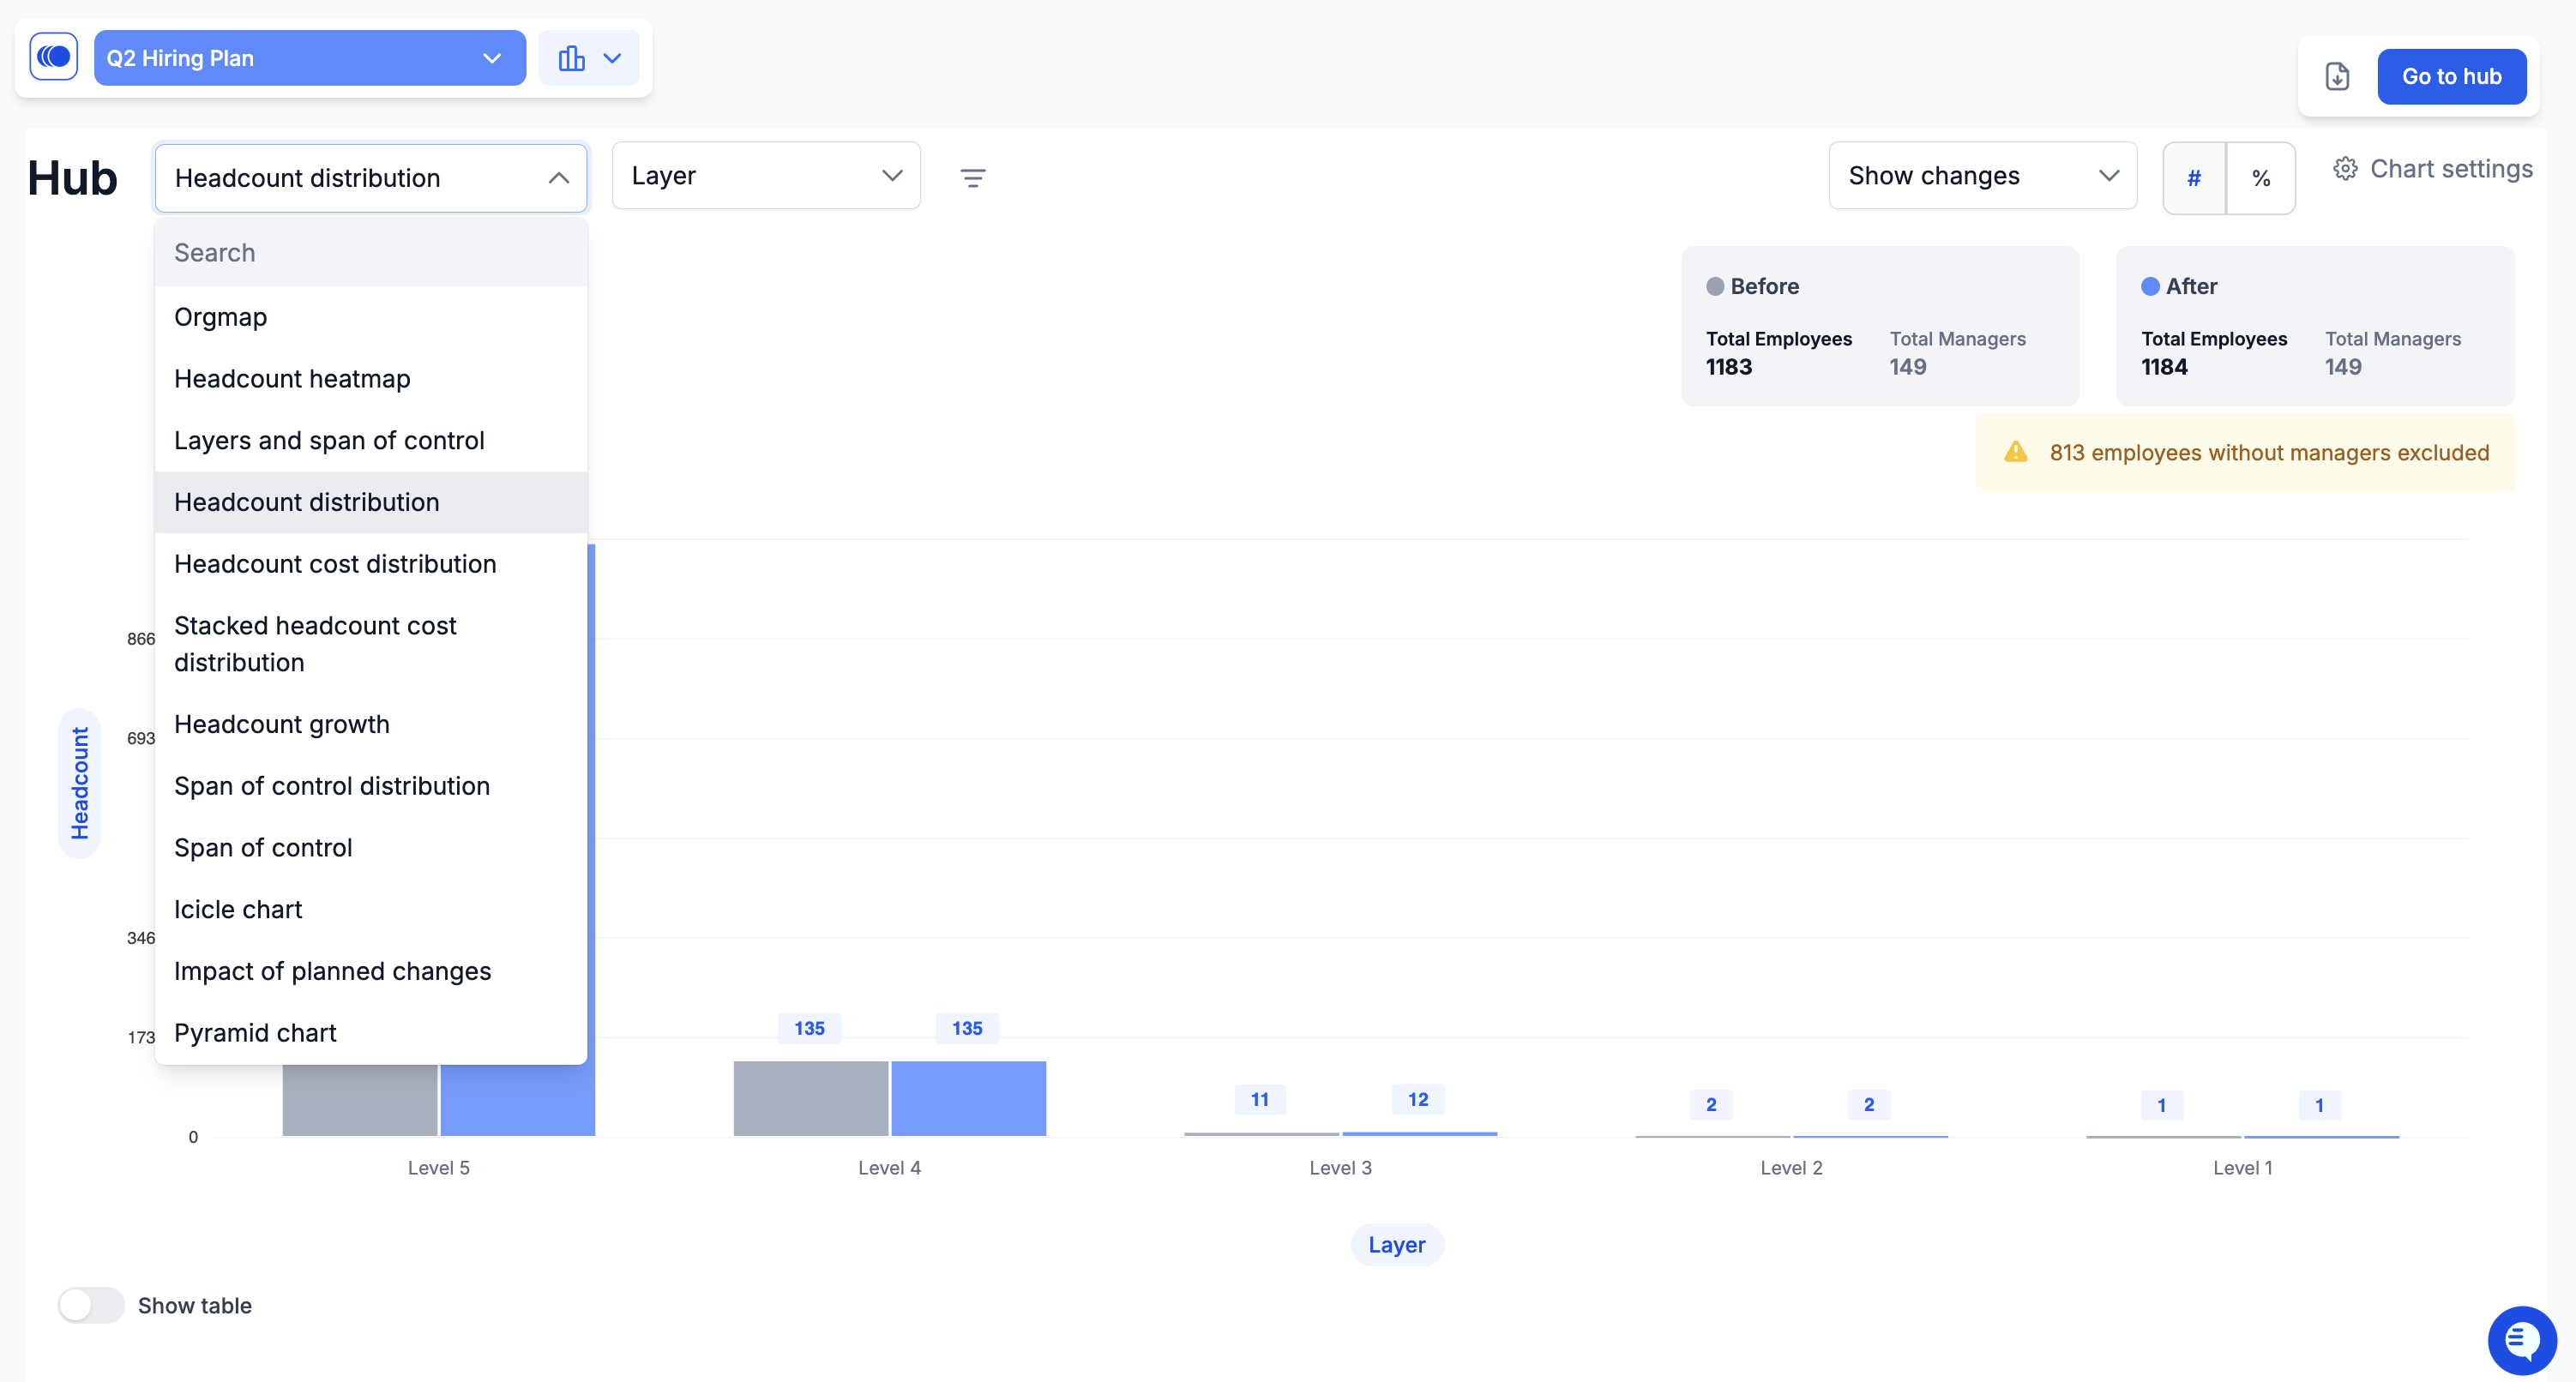
1. Click the **View Switcher** and select **Workforce Hub**.
2. Click on any preconfigured chart tile (for example, Headcount Distribution).

The chart opens with the chart selector dropdown at the top

3. Configure the chart axes and filters using the gear icon
4. Click **Export.**
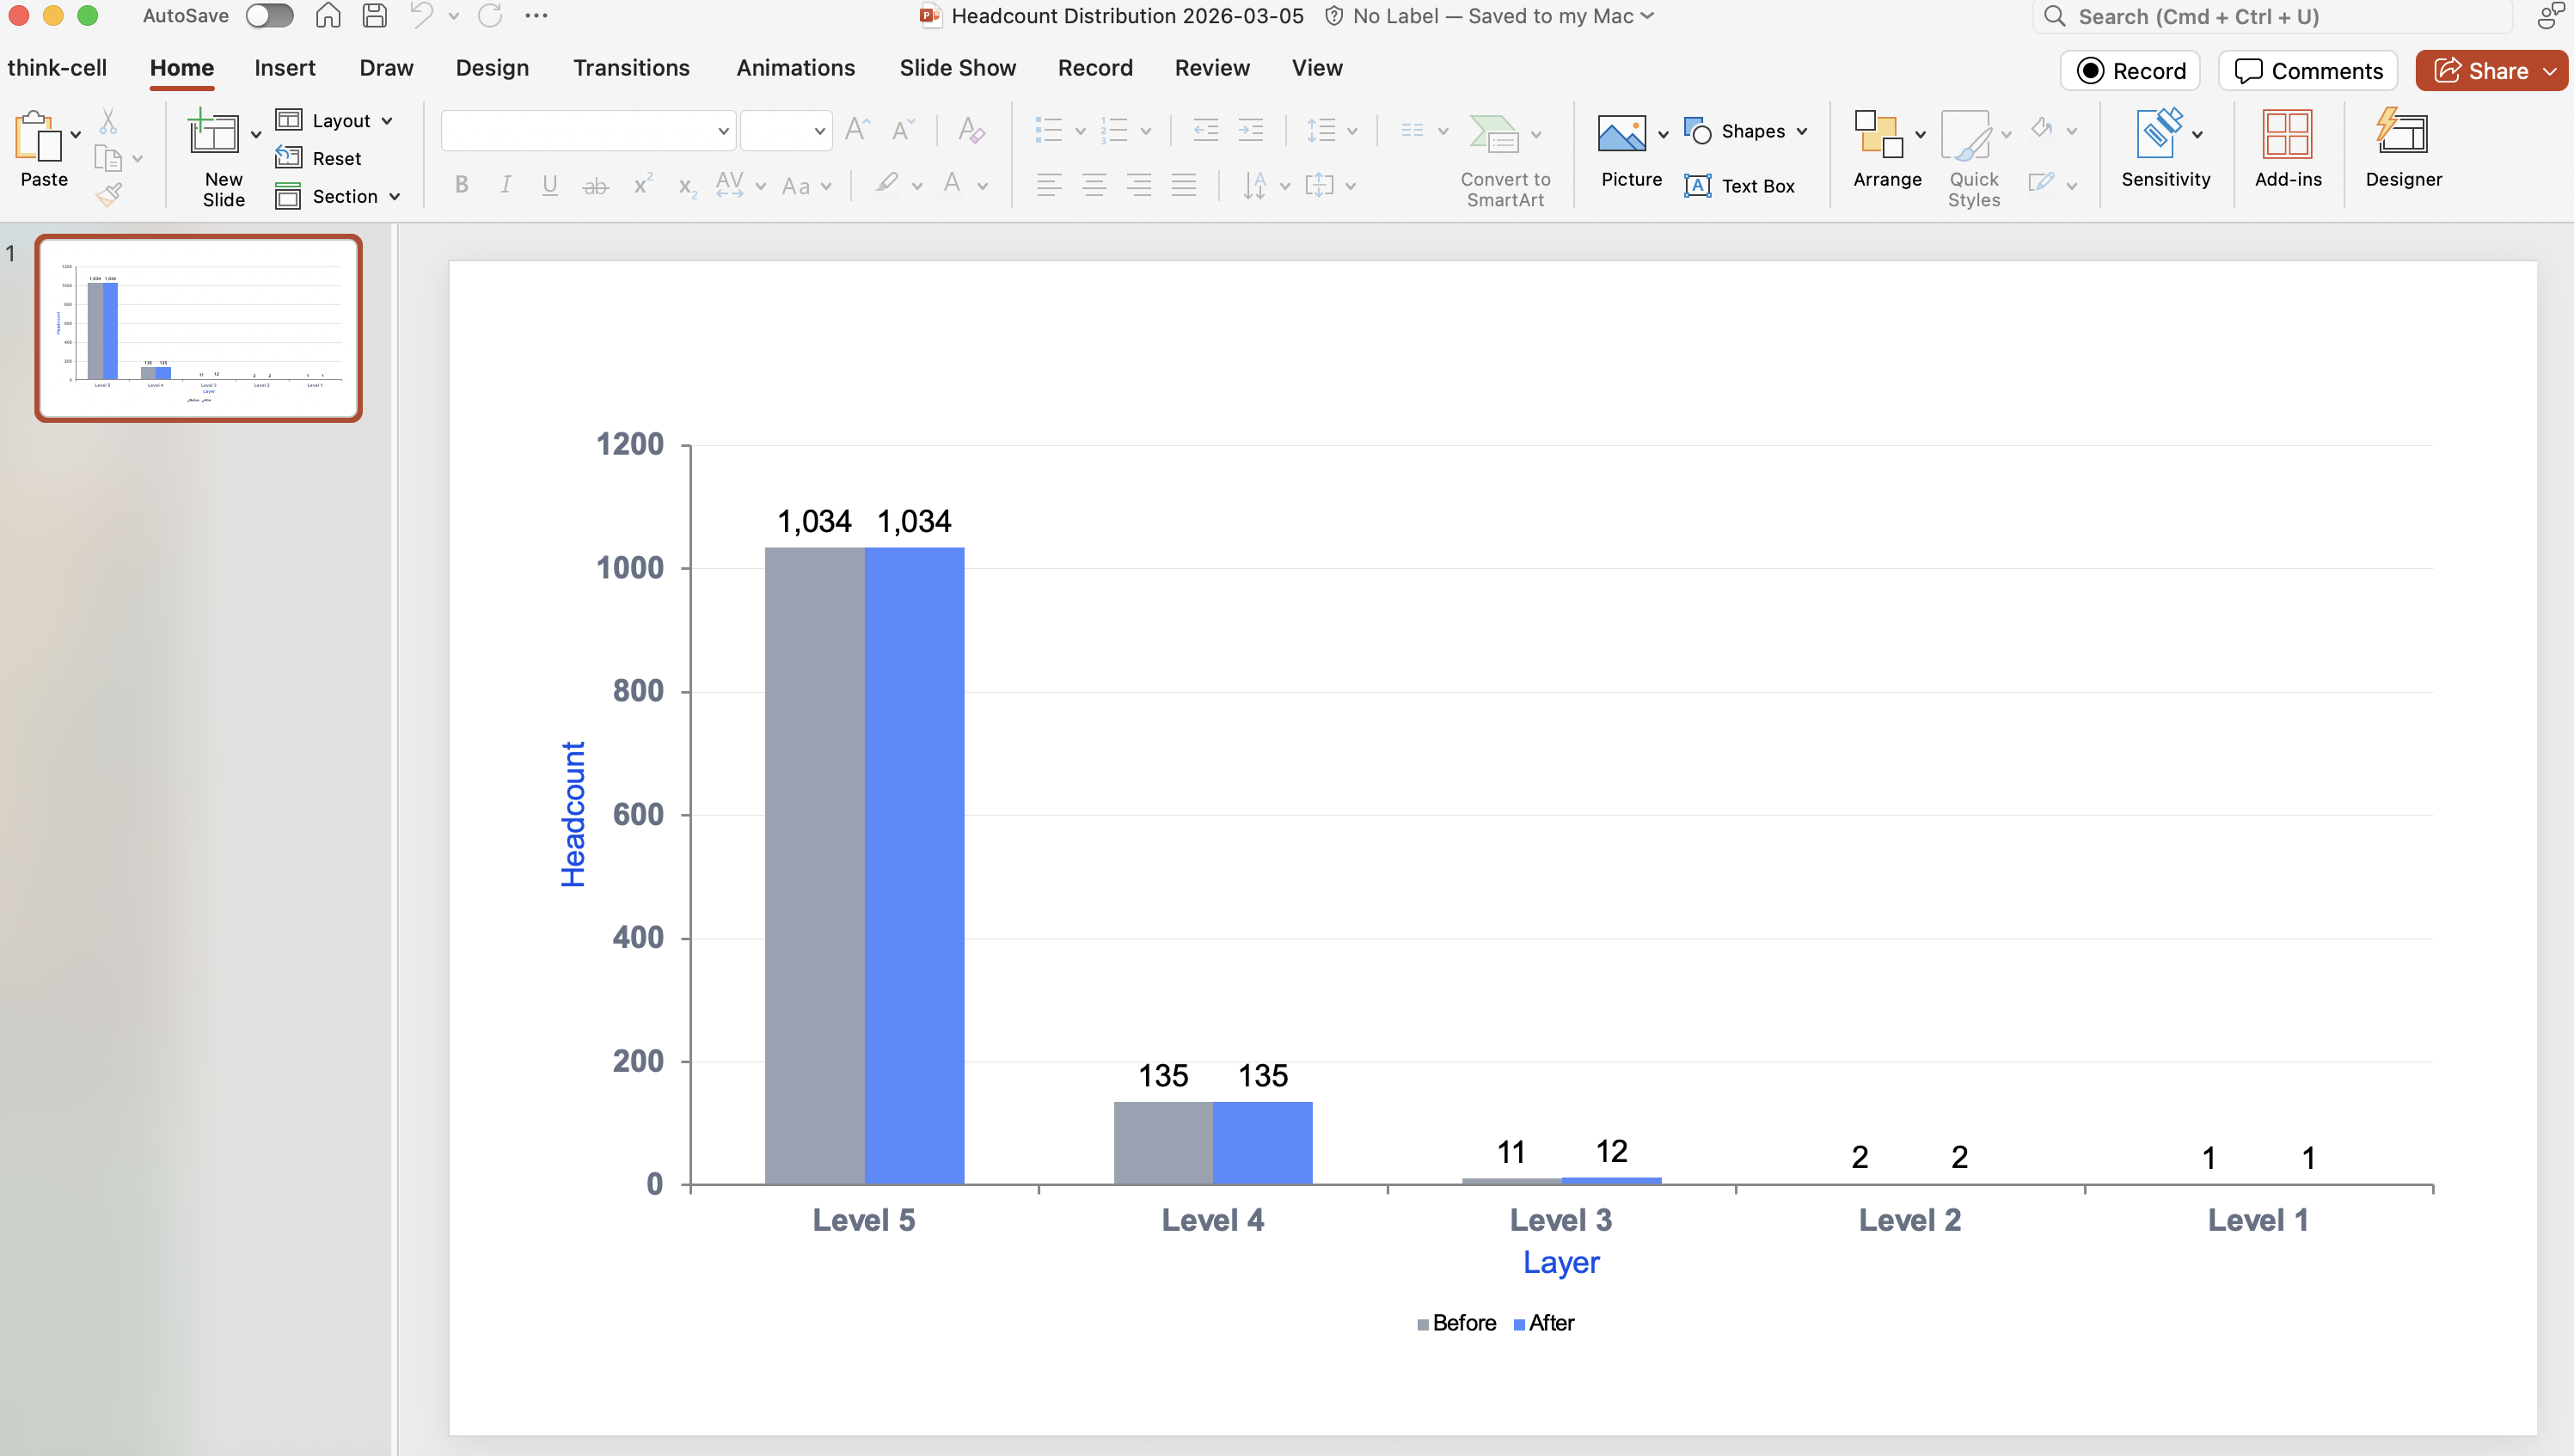
5. Choose **PowerPoint** to export the chart as an editable slide.

<figure><img src="https://2094208261-files.gitbook.io/~/files/v0/b/gitbook-x-prod.appspot.com/o/spaces%2FCZc46qaaBbVmMuYXPfgz%2Fuploads%2Fneg0PeckMrbK1mbHN3zW%2FScreenshot%202026-02-26%20at%209.07.19%E2%80%AFAM.png?alt=media&amp;token=e560788f-4d3a-4833-ba62-c4d97877a9b4" alt=""><figcaption></figcaption></figure>

6. The chart opens - now the chart selector dropdown appears at the top
7. Configure the chart axes and filters using the gear icon
8. The chart exports as an editable slide

<figure><img src="https://2094208261-files.gitbook.io/~/files/v0/b/gitbook-x-prod.appspot.com/o/spaces%2FCZc46qaaBbVmMuYXPfgz%2Fuploads%2FQXlFUOs1NYqByCRpyTXg%2FScreenshot%202026-02-26%20at%209.13.06%E2%80%AFAM.png?alt=media&amp;token=d28c413b-8aa4-4e7b-a6d0-c85573e44c1f" alt=""><figcaption></figcaption></figure>

## ✅ You're Ready!

If you can:

* Navigate Main Org
* Create a scenario
* Make and review changes
* View impact in Forecast
* Export insights

You’re ready to start planning with confidence.

## Next Steps

* [Agentnoon 101](/start-here/agentnoon-101) - Learn concepts in depth
* [Video Tutorials](/start-here/video-tutorials/video-tutorials) - Watch visual guides
* [Use Case Tutorials](/reference-guides/overview/planning-reorganization) - End-to-end workflows

Need help? Check our [Support & How to Self-Help](/start-here/support-self-help) guide!


# Platform Overview

A short introduction to Agentnoon — what the platform does, its core modules, and how they fit together. This page explains the main pieces so you know where to go next.

## What is Agentnoon?

Agentnoon helps you turn workforce data into clear insights so you can forecast costs, model changes, and respond quickly as business needs evolve.

With real-time dashboards and planning tools in one view, teams can run “what-if” scenarios, align plans to key goals, and make decisions faster and with greater confidence.

## Core Modules

The platform is built around a simple principle: understand your current state, model proposed changes, measure the impact, and share insights with stakeholders.

Agentnoon is organized into five modules. Each one serves a different purpose, but they all work from the same underlying data. Here's how the core modules fit together.

<figure><img src="https://2094208261-files.gitbook.io/~/files/v0/b/gitbook-x-prod.appspot.com/o/spaces%2FCZc46qaaBbVmMuYXPfgz%2Fuploads%2FcIH3suF9aPTrobcgsAQh%2FScreenshot%202026-04-22%20at%2012.15.34%E2%80%AFPM.png?alt=media&amp;token=a9dac463-3fe9-40c8-877d-6eeda0bff5f5" alt=""><figcaption></figcaption></figure>

#### Main Org

**Main Org** is your current, live organizational structure.

It reflects data imported from your HRIS or data source and is **view-only**. Use Main Org to explore reporting relationships, search for positions, and establish the baseline for scenario planning.

<figure><img src="https://2094208261-files.gitbook.io/~/files/v0/b/gitbook-x-prod.appspot.com/o/spaces%2FCZc46qaaBbVmMuYXPfgz%2Fuploads%2FlzikaiDw66TTcQsZzcDm%2FScreenshot%202026-02-26%20at%2010.06.36%E2%80%AFAM.png?alt=media&amp;token=6a08eb88-0de8-4225-b347-a407177bfbee" alt=""><figcaption></figcaption></figure>

#### Scenarios

**Scenarios** are **editable** copies of your organization where you can model changes without affecting live data.

Add, move, edit, or close positions, then review the cost and headcount impact in the OpEx Panel.

Use scenarios to plan reorganizations, model budget cuts, test team structures, compare multiple approaches, and submit proposals for approval.

<figure><img src="https://2094208261-files.gitbook.io/~/files/v0/b/gitbook-x-prod.appspot.com/o/spaces%2FCZc46qaaBbVmMuYXPfgz%2Fuploads%2FsqgGTAJIxsCK2K5Nbhei%2FScreenshot%202026-02-26%20at%2010.24.28%E2%80%AFAM.png?alt=media&amp;token=247d5bf2-fba8-45bc-92df-91f56005ee74" alt=""><figcaption></figcaption></figure>

#### Forecast

**Forecast** provides forward-looking headcount and cost projections over time.

It shows how scenario changes phase in based on hire dates and effective dates, using monthly, quarterly, or yearly views. Use Before, After, and Changes to compare projected impact.

<figure><img src="https://2094208261-files.gitbook.io/~/files/v0/b/gitbook-x-prod.appspot.com/o/spaces%2FCZc46qaaBbVmMuYXPfgz%2Fuploads%2FaCULZd4MjU1TxXx2I1ga%2FScreenshot%202026-02-26%20at%2010.27.04%E2%80%AFAM.png?alt=media&amp;token=77746b15-1645-455e-b8a6-9850aa2e9645" alt=""><figcaption></figcaption></figure>

#### Workforce Hub

**Workforce Hub** provides preconfigured analytics charts to help you analyze your organization.

Use charts such as Layers and Spans of Control, Headcount Distribution, and Heatmaps to review structure, depth, and distribution. Charts can be filtered and exported for presentations.

<figure><img src="https://2094208261-files.gitbook.io/~/files/v0/b/gitbook-x-prod.appspot.com/o/spaces%2FCZc46qaaBbVmMuYXPfgz%2Fuploads%2FVUNATpHNzNl5hrekoUAc%2FScreenshot%202026-02-26%20at%2010.27.52%E2%80%AFAM.png?alt=media&amp;token=44b802ac-7b1a-4c29-beb1-de9e355d9eac" alt=""><figcaption></figcaption></figure>

#### Directory

**Directory** is the table view of your organization.

Use it to sort, filter, and analyze position and employee data in rows and columns. In scenarios, Directory supports bulk edits and exports.

<figure><img src="https://2094208261-files.gitbook.io/~/files/v0/b/gitbook-x-prod.appspot.com/o/spaces%2FCZc46qaaBbVmMuYXPfgz%2Fuploads%2FamCK6MqOJmbDHpwoipyT%2FScreenshot%202026-02-26%20at%2010.28.24%E2%80%AFAM.png?alt=media&amp;token=5dcccdc1-b56a-446e-b059-f9d091fbb342" alt=""><figcaption></figcaption></figure>

## How the Modules Work Together

A typical workflow moves through the modules in this order:

1. **Main Org** — Understand your current state.
2. **Workforce Hub** — Analyze structure and identify opportunities.
3. **Scenarios** — Model proposed changes.
4. **Forecast** — Project headcount and cost over time.
5. **Directory** — Export detailed data for reporting.

Each module supports a specific stage of workforce planning, working together as a connected system.


# Key Concepts

Essential concepts for understanding Agentnoon

These core concepts will help you navigate Agentnoon and understand how workforce planning works within the platform.

## Positions vs People

#### **Position**

A job role in your organization, whether filled or open. Positions include attributes such as title, department, salary range, and reporting structure.

#### **People (Employee)**

The individual assigned to a position. One person can only fill one position at a time.

:bulb: Agentnoon is primarily position-based. You plan by creating and modifying positions first, then assigning people to them. This allows you to model future organizational structures before roles are filled.

<figure><img src="https://2094208261-files.gitbook.io/~/files/v0/b/gitbook-x-prod.appspot.com/o/spaces%2FCZc46qaaBbVmMuYXPfgz%2Fuploads%2FQrFcP5HeTOioPvQ610LD%2FScreenshot%202026-02-26%20at%209.33.39%E2%80%AFAM.png?alt=media&amp;token=c74ae7c2-830f-4635-9e24-010aa7a45474" alt=""><figcaption></figcaption></figure>

## Main Org vs Scenarios

#### **Main Org**

Your **current-state** organization as it exists today.

* View-only (cannot be edited directly)
* Reflects real-time or imported data
* Updated through data sync
* Serves as the baseline for scenario planning

**Learn more:** [Key Concepts for Main Org](/main-org/overview)

#### **Scenarios**

Editable copies of Main Org used for planning **future** changes.

* Support what-if modeling
* Track additions, reductions, and modifications
* Can be compared, shared, and submitted for approval

Scenarios are isolated from Main Org until changes are implemented externally and data is refreshed.

**Learn more:** [Key Concepts for Scenarios](/scenarios/key-concepts-scenarios)

## Views: Org Chart vs Directory

#### Org Chart View

A visual, hierarchical view that displays reporting relationships.

Best used for:

* Understanding organizational structure
* Visualizing reporting lines
* Drag-and-drop changes in scenarios

#### Directory View

A table-style view of all positions and employees with sortable columns.

Best used for:

* Bulk analysis
* Filtering and sorting data
* Exporting structured reports

:bulb: You can switch between Org Chart and Directory views at any time with keyboard shortcuts (3 for Org Chart, 5 for Directory).

<figure><img src="https://2094208261-files.gitbook.io/~/files/v0/b/gitbook-x-prod.appspot.com/o/spaces%2FCZc46qaaBbVmMuYXPfgz%2Fuploads%2FmrXWTGzI24iBgQsdZz8H%2FScreenshot%202026-02-26%20at%209.38.48%E2%80%AFAM.png?alt=media&amp;token=26c74a19-bf76-4858-845e-47bfca283c6f" alt=""><figcaption></figcaption></figure>

## Cards

In Org Chart view, each position appears as a card.

Cards display key information such as:

* Name and title
* Department
* Direct reports count
* Additional selected attributes

Card content can be configured to display different fields, including calculated metrics.

**Card interactions:**

* Click to open detail panel
* Hover to see quick info
* Drag to move to new manager (in scenarios)
* Color-coded indicators show change type (in scenarios)

<figure><img src="https://2094208261-files.gitbook.io/~/files/v0/b/gitbook-x-prod.appspot.com/o/spaces%2FCZc46qaaBbVmMuYXPfgz%2Fuploads%2F8QNw4OhgojSAvbL3XlRs%2FScreenshot%202026-02-26%20at%209.57.10%E2%80%AFAM.png?alt=media&amp;token=5d8f1e05-8d2b-49d3-a880-4793e843ce92" alt="" width="292"><figcaption></figcaption></figure>

## Attributes vs Fields

#### **Attributes**

Data points about positions or people (for example, Department, Location, Salary, Title).

#### **Fields**

How attributes are organized and displayed in the platform.

Attributes appear throughout the system — on cards, in the Directory, in analytics charts, in filters, and in exports.&#x20;

There are two types of attributes:

1. **System attributes** (FX)\
   Calculated automatically by the platform. These update automatically as the organization changes. Examples include:

   * Span of Control
   * Layer
   * Total Org Size
   * Cost Impact

2. **Custom attributes**&#x20;

   Defined by your administrator to reflect your organization’s structure. Custom attributes can be used in filters, highlights, analytics, and exports. Examples may include:

   * Business Unit
   * Cost Center
   * Employee Type
   * Pay Grade

**Learn more:** [Fields and Attributes](/start-here/agentnoon-101/fields-and-attributes)

## Spans and Layers

#### Span of Control (SOC)

Span of Control helps evaluate management distribution and organizational balance. It is calculated automatically and reflects the number of positions that report directly to a given position.

Common ranges:

* **Individual Contributors:** 0 direct reports
* **First-Line Managers:** 5–10 direct reports
* **Mid-Level Managers:** 5–8 direct reports
* **Executives:** 5–10 direct reports

<figure><img src="https://2094208261-files.gitbook.io/~/files/v0/b/gitbook-x-prod.appspot.com/o/spaces%2FCZc46qaaBbVmMuYXPfgz%2Fuploads%2FML5A2MYJHP7TaHUVysR8%2FScreenshot%202026-02-26%20at%209.59.43%E2%80%AFAM.png?alt=media&amp;token=74211769-5e82-408f-8618-435f60579b27" alt=""><figcaption></figcaption></figure>

#### Layers

Layers help define organizational depth and represents the number of management levels between a position and the CEO. Industry best practice typically ranges from 4–7 layers for most companies, depending on size and complexity.

Example:

* CEO: Layer 0
* VP: Layer 1
* Director: Layer 2
* Manager: Layer 3
* Individual Contributor: Layer 4

## Permissions & Access Control

#### **Access Groups**

Access Groups define who can see what data in the platform and can be scoped based on department, location, or other defined attributes.

Permission Levels:

* Viewer: Can see data, cannot edit
* Planner: Can create and edit scenarios
* Approver: Can approve scenario changes
* Admin: Full system access, configuration

Permissions are configured by administrators.

**Learn more:** [Access Control](/admin-capabilities/overview-1)

## Deep Dives

* [Key Concepts for Main Org](/main-org/overview) — Data sync, read-only nature, baseline for scenarios
* [Key Concepts for Scenarios](/scenarios/key-concepts-scenarios) — Change types, OpEx Panel, approvals, comparisons


# Agentnoon 101

Foundational concepts and terminology to understand Agentnoon

This section introduces the building blocks of Agentnoon — the modules, the interface elements, and the data structure behind your org chart.

## In This Section

1. [Cards](/start-here/agentnoon-101/cards) — How positions and employees are displayed in the org chart
2. [Views](/start-here/agentnoon-101/views) — How to set saved views within Agentnoon
3. [Fields and Attributes](/start-here/agentnoon-101/fields-and-attributes) — The data that powers your organization
4. [Scenarios Fundamentals](/start-here/agentnoon-101/scenarios-fundamentals) — How what-if planning works
5. [Workforce Hub Fundamentals](/start-here/agentnoon-101/workforce-hub-fundamentals) — Analytics and insights

We recommend reading these in order, as each topic builds on the previous one.


# Cards

Understanding position and employee cards

Cards are the building blocks of the org chart. Each card represents a position in your organization and displays key information at a glance.

<figure><img src="https://2094208261-files.gitbook.io/~/files/v0/b/gitbook-x-prod.appspot.com/o/spaces%2FCZc46qaaBbVmMuYXPfgz%2Fuploads%2FlzikaiDw66TTcQsZzcDm%2FScreenshot%202026-02-26%20at%2010.06.36%E2%80%AFAM.png?alt=media&amp;token=6a08eb88-0de8-4225-b347-a407177bfbee" alt=""><figcaption></figcaption></figure>

## What's on a Card

Cards only show selected content that is added in from the Card Content panel. By default, cards only show **name** and **job title.**&#x20;

Positions with an assigned employee show the employee's name when the Name attribute is selected in card content (the actual name of this may vary depending on your imported data). Vacant positions show the position title only and a blank name.

## Customizing Card Content

<figure><img src="https://2094208261-files.gitbook.io/~/files/v0/b/gitbook-x-prod.appspot.com/o/spaces%2FCZc46qaaBbVmMuYXPfgz%2Fuploads%2FZWLp6wIZZVjl6okIHa6e%2FScreenshot%202026-02-27%20at%201.50.36%E2%80%AFAM.png?alt=media&amp;token=42440653-bcdd-4747-bde8-170b4e5d4a84" alt=""><figcaption></figcaption></figure>

1. Click **Card Content** in the toolbar
2. Select which attributes to display (Work City, Pay Grade, Span of Control, etc.)
3. Use the **gear button** in the top right to rearrange field order
4. Changes apply immediately to all visible cards

Fields marked with **FX** are calculated automatically by Agentnoon (Span of Control, Total Org Size, Layer).

## Highlighting

<figure><img src="https://2094208261-files.gitbook.io/~/files/v0/b/gitbook-x-prod.appspot.com/o/spaces%2FCZc46qaaBbVmMuYXPfgz%2Fuploads%2FqQoKNAE8QXV4sM7IIBzf%2FScreenshot%202026-02-27%20at%201.52.04%E2%80%AFAM.png?alt=media&amp;token=f57ddad8-2b75-4804-b52c-34668d270ed5" alt=""><figcaption></figcaption></figure>

Color-code cards by any attribute:

1. Click **Highlight** in the toolbar
2. Select an attribute (e.g., Department, Work Country, Pay Grade)
3. Cards color-code automatically with a legend showing what each color represents

## Interacting with Cards

**In the Main Org** (view-only): Click to expand or collapse reporting lines. Use search to find specific positions.

**In Scenarios** (editable): Hover over a card to see action buttons for adding positions below, editing details, assigning employees, duplicating, or closing the position. Drag cards to move them to a new manager. Select multiple cards for bulk actions.

## Positions vs People (Employees)

**Positions** represent roles in the org structure. They persist even when vacant, allowing you to plan for unfilled roles.

**Employees** are individuals assigned to positions. In scenarios, employees can be moved between positions or detached to the bench during restructuring.


# Fields and Attributes

Understanding data structure and custom fields

In Agentnoon, fields and attributes mean the same thing. They are the data points that define your organization, such as Job Title, Department, Salary, Location, Start Date, and Skills. This section explains the minimum data needed to build your org, the main attribute types used in Agentnoon, how custom fields are imported, and how fields behave across cards, filters, formulas, Workforce Hub, Forecast, and exports.

Fields appear on cards, in the directory, in analytics charts, in filters, and in exports.

### Attribute Types

All extra attributes are imported through Custom Fields. After uploading your data, go to Attributes & Formulas and assign the right type to each field.

#### **Text**

Use Text for labels and categories. Examples: Job Title, Department, Location, Business Unit.&#x20;

Import the column as a custom field and keep the type as Text.

#### **Number**

Use Number for non-currency values. Examples: Performance Score, FTE, Open Roles, Span Target.&#x20;

Import the column as a custom field, set the type to Number, and use it in formulas like FTE + Open Roles or Performance Score \* 10.

#### **Monetary**

Use Monetary for money fields. Examples: Salary, Bonus, Benefits, Allowance, Total Compensation. Import the column as a custom field, set the type to Monetary, and use it in formulas like Salary + Bonus.&#x20;

Monetary fields can also be used in Forecast and in the Stacked Headcount Cost chart in Workforce Hub.

#### **Array**

Use Array when one field contains multiple values. Examples: Skills = Analytics, QA, Design; Certifications = CPA, CFA; Tools = Excel, SQL, Tableau.&#x20;

Import the column as a custom field with comma-separated values, then change the type from Text to Array so filters split the values into separate unique options.

#### **Date**

Use Date for time-based fields. Examples: Start Date, End Date, Hire Date, Termination Date. Import the column as a custom field, set the type to Date, and Agentnoon will treat it as a range filter instead of a normal dropdown.

### **Position Fields vs People Fields**

Position fields are tied to roles and persist even when vacant. Example position fields include: Job Title, Department, Pay Grade, Location, Reports To.

People fields are tied to individuals and removed when someone leaves. Example people fields include: Employee Name, Employee ID, Start Date, Email, Performance Rating.

This separation lets you plan with positions independently of the people who fill them.

Note that while Salary may be a position-level field in some contexts, Agentnoon treats the mapped Salary field as a People field by default. Attaching or detaching people from positions will result in their salary coming along.

### Groups

Fields are organized into groups such as Compensation, Contact Info, and Job Details. Groups appear as sections in the edit panel when you click on a position, making it easier to find related fields. Admins can create and manage groups in Settings > Fields.

### Calculated Fields (FX)

Some fields are computed automatically by Agentnoon and marked with FX:

* Span of Control — Number of direct reports
* Total Organization Size — Everyone under a manager (direct + indirect)
* Layer — Distance from the CEO
* Average SOC — Average span across the organization

These update in real time as the org structure changes.

### Where Fields Appear

* Cards — Configure which fields display via Card Content in the toolbar
* Directory — Add, remove, and reorder columns
* Workforce Hub — Fields power the axes and breakdowns of charts
* Filters — Filter by any field value across the product
* Highlighting — Color-code cards by any field
* Exports — Include any field in CSV, Excel, or PowerPoint exports

### Admin Configuration

Admins can add custom fields, set data types such as text, number, date, monetary, or array, define restricted dropdown values for consistency, and control field visibility by access group. See [Fields and Attributes Management](/admin-capabilities/overview-3).

#### Minimum Required Data (Data Upload)

Fields required for data upload

**Absolute minimum:**

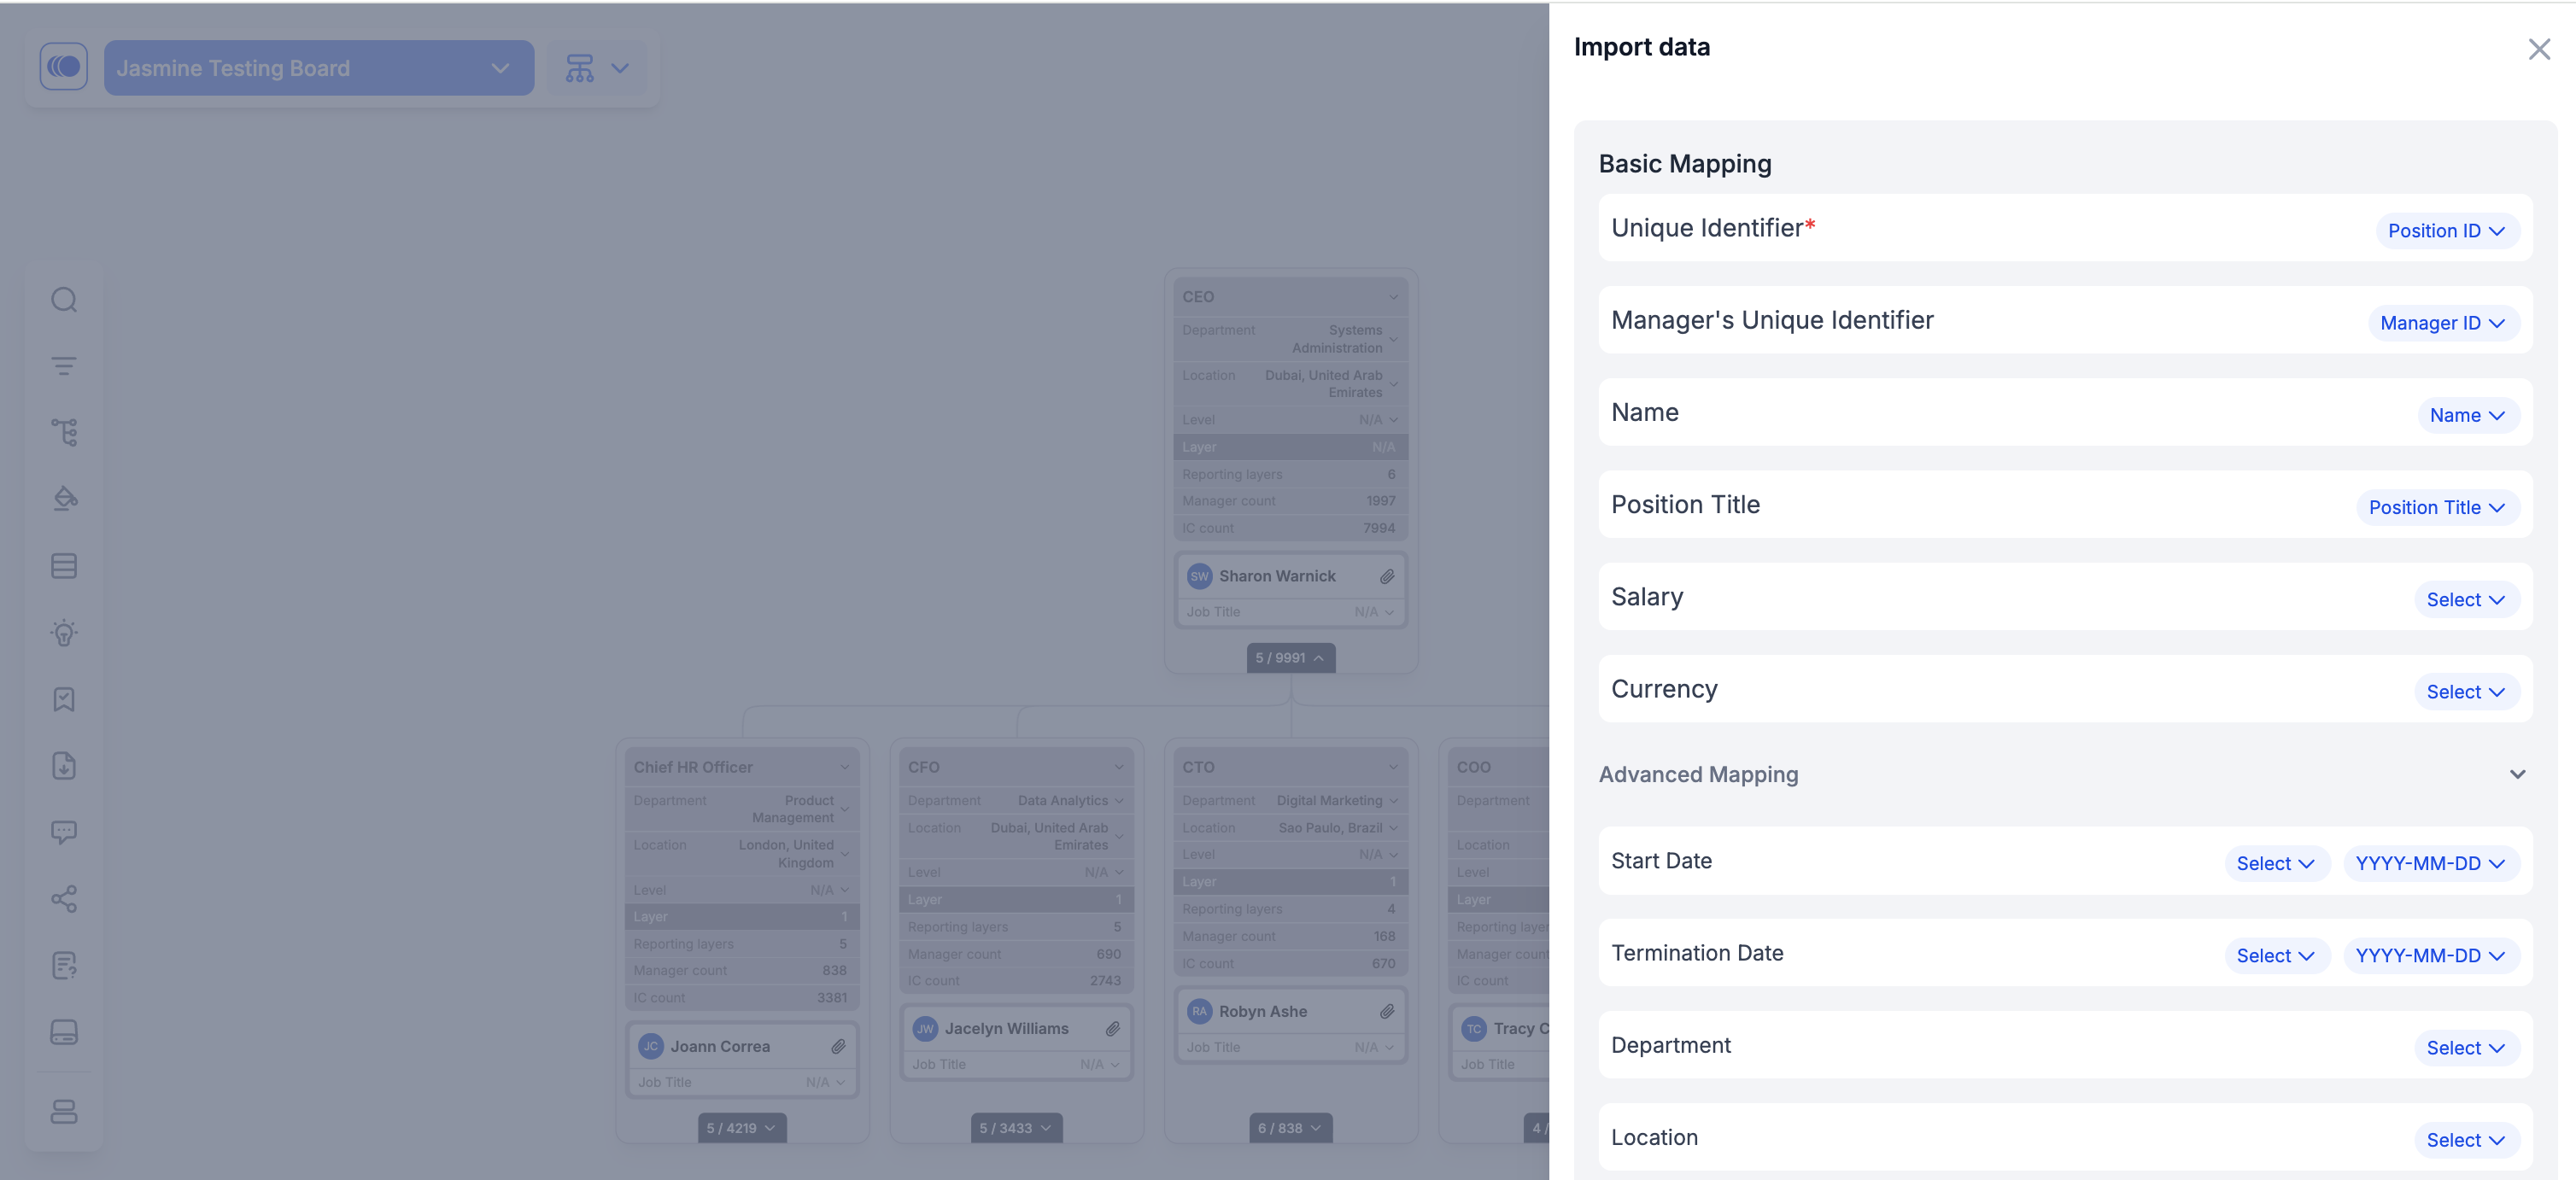
* Position ID or Employee ID
* Manager Position ID or Manager Employee ID
* Position Name

**Recommended for greater functionality:**

* Job Title, Department, Manager, Location, Name, Employee ID, Start Date, Total Compensation.

<figure><img src="https://2094208261-files.gitbook.io/~/files/v0/b/gitbook-x-prod.appspot.com/o/spaces%2FCZc46qaaBbVmMuYXPfgz%2Fuploads%2Fd8Ul4qfLyADfDm0Pr8WW%2FScreenshot%202026-02-27%20at%201.55.20%E2%80%AFAM.png?alt=media&amp;token=e4a876fc-e869-4437-9291-fb4c498e7012" alt=""><figcaption></figcaption></figure>


# Views

Once the changes are made in a scenario, you may want to preserve the updated structure or return to a previous version

#### What Are Views?

Views allow you to capture and revisit specific states of your scenario. They help you:

* Track changes made to the structure
* Compare current updates with the original (base) version
* Save configurations for future use

#### Accessing Orgchart Views

To access Orgchart views:

1. Navigate to the **Orgchart** **module**
2. Navigate to the **left toolbar**
3. Click on **Views**

Here, you will see:

* The **Base View** (original state)
* Any **changes** that have been made

The system highlights differences, making it easy to identify what has been modified.

<figure><img src="https://2094208261-files.gitbook.io/~/files/v0/b/gitbook-x-prod.appspot.com/o/spaces%2FCZc46qaaBbVmMuYXPfgz%2Fuploads%2FaoPhT2GEdurRLgRUvOFY%2Fimage.png?alt=media&amp;token=97c93fa5-5ddd-4d24-b34d-f2467cd83c25" alt=""><figcaption></figcaption></figure>

#### Accessing Directory Views

To access Directory views:

1. Navigate to **Directory module**
2. Navigate to the **left toolbar**
3. Click on **Customize table** and save a view first
4. Then, click on **Views** from the **left toolbar** to access your saved views

Here, you will see:

* **All columns** (original state)
* Any **new views created**

<figure><img src="https://2094208261-files.gitbook.io/~/files/v0/b/gitbook-x-prod.appspot.com/o/spaces%2FCZc46qaaBbVmMuYXPfgz%2Fuploads%2FTp3wQKnv9C74AKhpCSRs%2FScreenshot%202026-03-26%20at%202.49.12%E2%80%AFPM.png?alt=media&amp;token=ca1b765f-39e3-45b5-b0bc-7735a3d6e823" alt=""><figcaption></figcaption></figure>

#### Saving an Orgchart View

If you want to preserve your current scenario setup:

1. Click on **Save Current View**
2. Enter a name (e.g., *Global View 1*)
3. Save the view

This allows you to return to this exact configuration later.

<figure><img src="https://2094208261-files.gitbook.io/~/files/v0/b/gitbook-x-prod.appspot.com/o/spaces%2FCZc46qaaBbVmMuYXPfgz%2Fuploads%2F5mQvQKpejtVCQ16zyz6N%2Fimage.png?alt=media&amp;token=25c76941-c5de-43b0-aee5-156070906e5c" alt=""><figcaption></figcaption></figure>

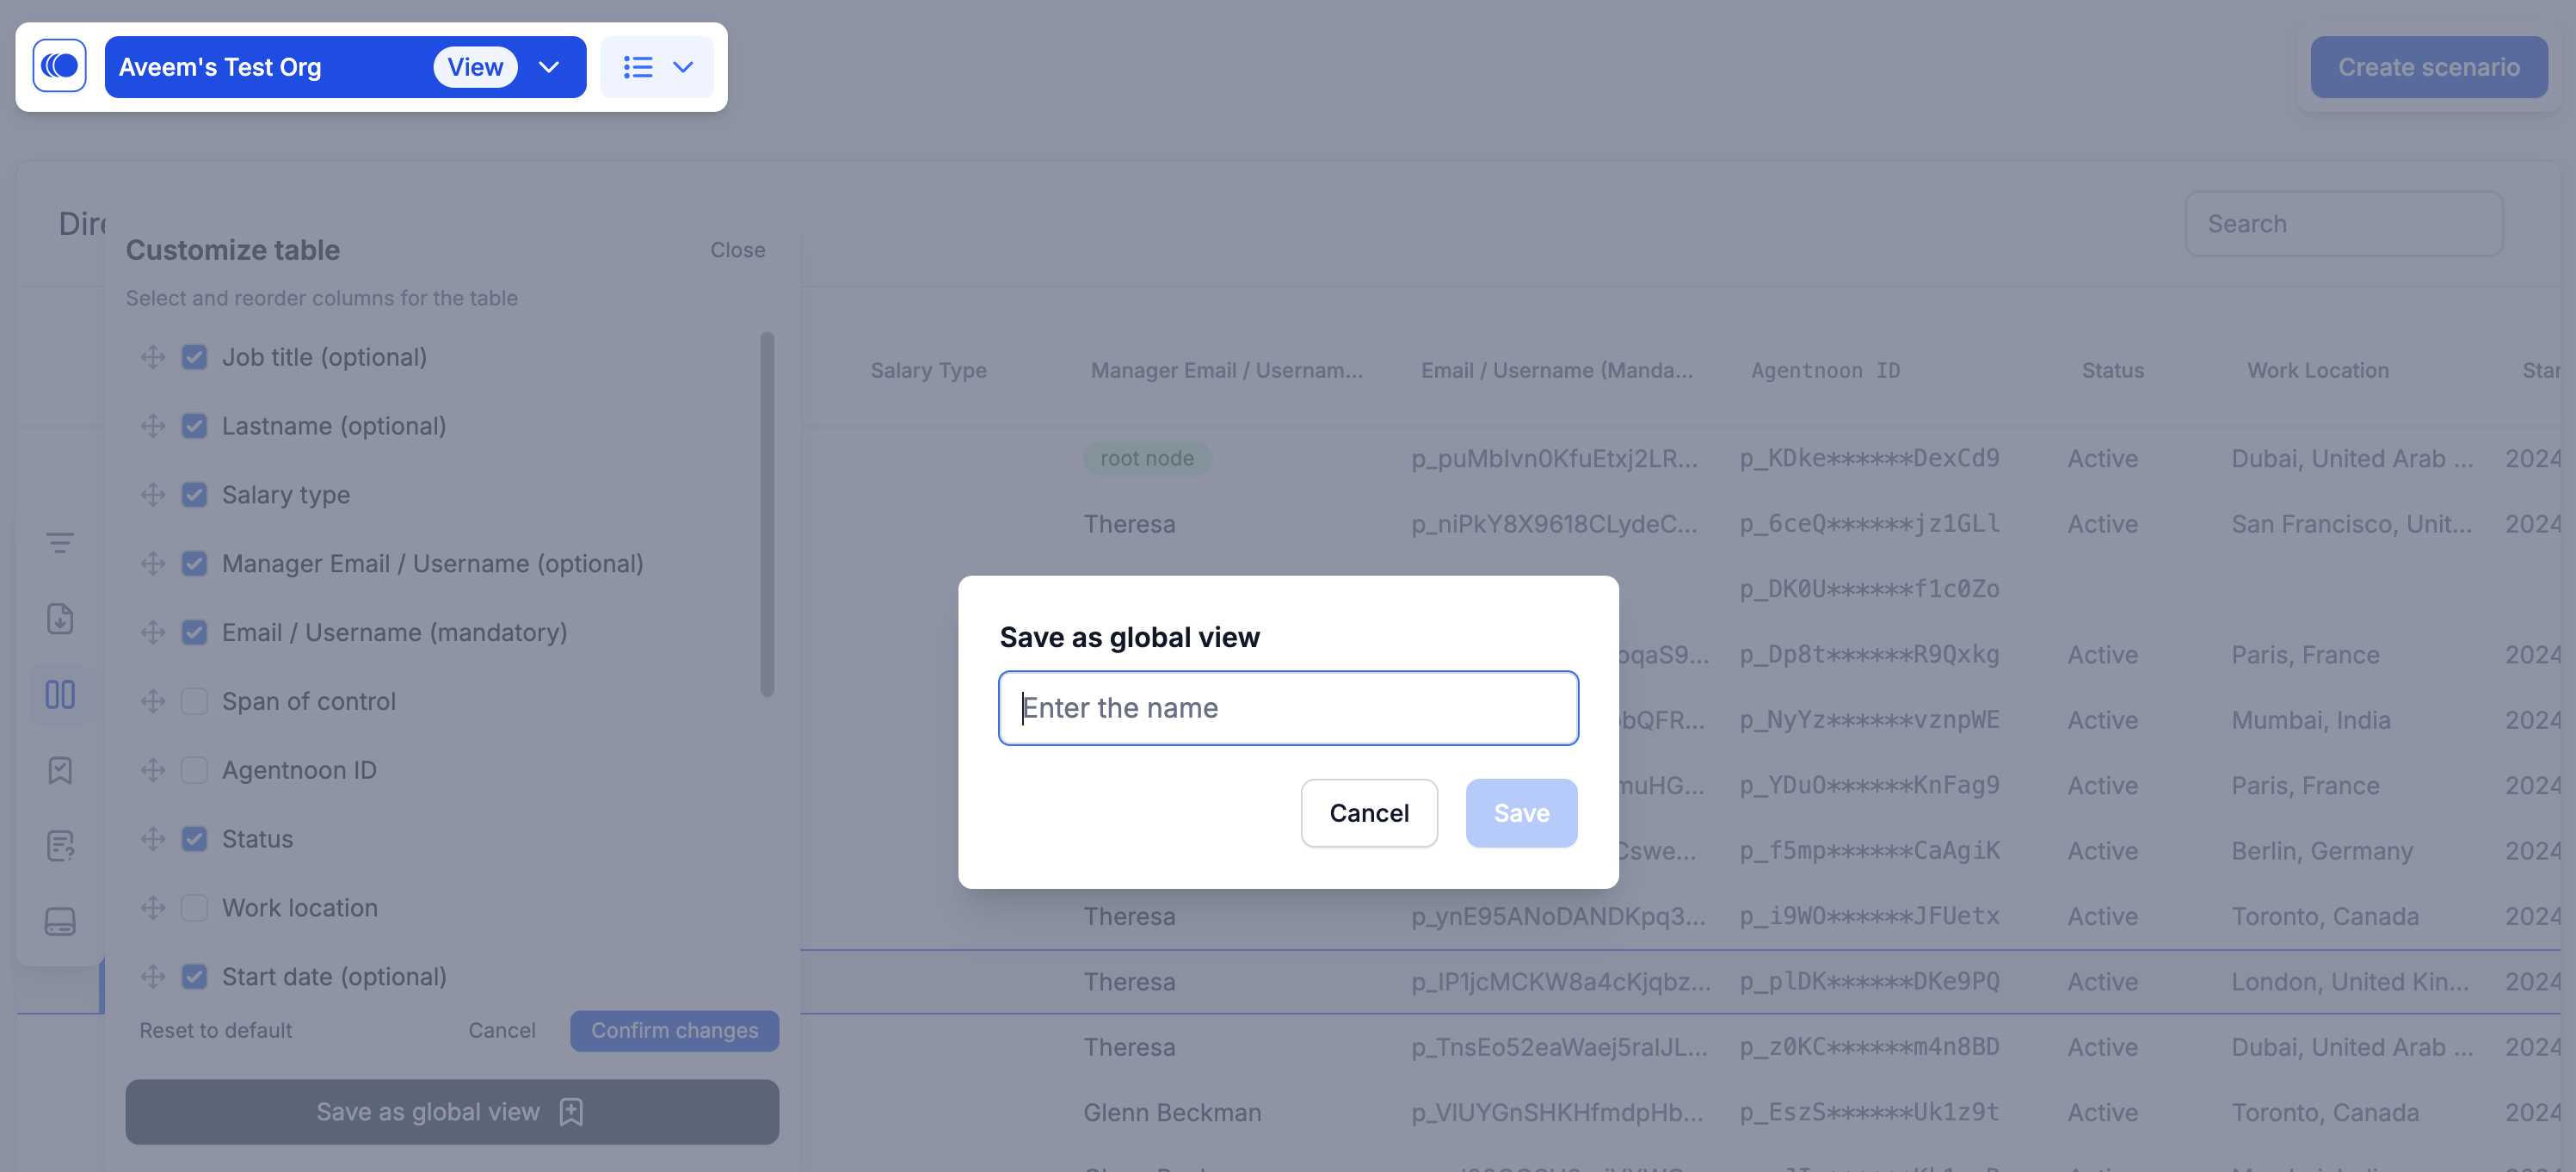
#### Saving a Directory View

If you want to preserve your current directory setup:

1. Go into **Customize table**
2. Click on **Save as global view**
3. Enter a name (e.g., *Global View 1*)
4. Save the view

(**Note:** Only admins can set global views)

<figure><img src="https://2094208261-files.gitbook.io/~/files/v0/b/gitbook-x-prod.appspot.com/o/spaces%2FCZc46qaaBbVmMuYXPfgz%2Fuploads%2FOzMf3tNpyjSJdViAJVS3%2FScreenshot%202026-03-26%20at%202.49.26%E2%80%AFPM.png?alt=media&amp;token=94cb8908-9569-420a-ad51-10423d83fa3e" alt=""><figcaption></figcaption></figure>

#### Sharing Views with Others / Global Views

If you want your view to be accessible to other users:

* Select **Save as Global View** when saving

Once saved:

* The view will appear under **Global Views**
* Other users with access to the main org & scenario can also see and use it \
  (**Note:** Their access scopes will apply, if the user doesn't have access to a particular field inside a view - it won't show up for them)

#### Access Control Considerations

Visibility of global views depends on user permissions. Only users with the appropriate access rights will be able to view and interact with shared views.


# Scenarios Fundamentals

What scenarios are and when to use them

A scenario is an editable copy of your org where you can model changes without affecting live data. Changes in a scenario are completely isolated from the Main Org until you choose to implement them.

## When to Create a Scenario

<figure><img src="https://2094208261-files.gitbook.io/~/files/v0/b/gitbook-x-prod.appspot.com/o/spaces%2FCZc46qaaBbVmMuYXPfgz%2Fuploads%2FFGh2DjLXT1feEyVQtgHC%2FScreenshot%202026-02-24%20at%201.24.21%E2%80%AFPM.png?alt=media&amp;token=fd660cdc-688f-4265-a4fb-4e8a9d07ea4e" alt=""><figcaption></figcaption></figure>

<figure><img src="https://2094208261-files.gitbook.io/~/files/v0/b/gitbook-x-prod.appspot.com/o/spaces%2FCZc46qaaBbVmMuYXPfgz%2Fuploads%2FsNcD1IFoNSCj8SryAFL6%2FScreenshot%202026-02-24%20at%201.25.20%E2%80%AFPM.png?alt=media&amp;token=8e071409-99a6-40f5-9585-75df1c161705" alt=""><figcaption></figcaption></figure>

<figure><img src="https://2094208261-files.gitbook.io/~/files/v0/b/gitbook-x-prod.appspot.com/o/spaces%2FCZc46qaaBbVmMuYXPfgz%2Fuploads%2FsqgGTAJIxsCK2K5Nbhei%2FScreenshot%202026-02-26%20at%2010.24.28%E2%80%AFAM.png?alt=media&amp;token=247d5bf2-fba8-45bc-92df-91f56005ee74" alt=""><figcaption></figcaption></figure>

Create a scenario whenever you need to model changes to your org structure:

* Plan a reorganization or restructure
* Model headcount additions or reductions
* Explore and compare multiple approaches
* Prepare a proposal for stakeholder approval
* Run annual or quarterly planning

## Scenario Types

**Full Org** — Copy of your entire organization. Use for company-wide planning.

**Partial Org** — Copy of a subset of your organization. Faster to create and easier to work with. Most commonly used.

**New Org** — Blank canvas. Use when building a new department or team from scratch.

## What You Can Do in a Scenario

**Position actions:** Add new positions, edit details (title, salary, department), move positions to a new manager, close positions (RIF or Exit), and duplicate positions.

**Bulk actions:** Select multiple positions and change manager, edit attributes, or close them in batch.

**People actions:** Assign employees to positions, detach employees (creating vacancies), or move employees to the bench during restructuring.

## Reviewing Impact

The **OpEx Panel** shows the real-time impact of every change you make — additions, reductions, and modifications with cost and headcount impact. Check it frequently to track progress against your goals. See [Scenario Changes & Impact](/scenarios/opex-panel).

## Time-Based Planning

Set **effective dates** on changes to schedule when they take effect. Forecast then shows the phased impact over time — for example, 5 hires in Q1 and 3 in Q2. See [Time-Based Planning](/scenarios/time-based-planning).

## Approval Workflow

When your scenario is ready, submit it for approval through the OpEx Panel. Scenarios move through approval levels (Level 0 → 1 → 2 → 3) and lock once approved. See [Scenario Approvals](/scenarios/approvals).

## Comparing Scenarios

Create multiple versions (Option A, Option B) and compare them side-by-side on cost, headcount, and structural metrics. Comparisons are started from the homepage. See [Scenario Comparisons](/scenarios/comparisons).

## Scenarios vs Forecast

**Scenarios** model specific structural changes — who reports to whom, exact positions, team design.

**Forecast** projects aggregate numbers over time — headcount by quarter, cost by department, multi-year growth.

Use both together: create a Forecast for high-level targets, then build Scenarios to model the specific org structures that achieve them.


# Workforce Hub Fundamentals

Introduction to workforce analytics and insights

Workforce Hub is Agentnoon's analytics module. It provides pre-built charts that turn your org data into visual insights — span of control distribution, headcount breakdowns, organizational depth, and more.

Workforce Hub is for **analysis**, not editing. Use it to understand your org structure, then model changes in Scenarios.

## Available Charts

<figure><img src="https://2094208261-files.gitbook.io/~/files/v0/b/gitbook-x-prod.appspot.com/o/spaces%2FCZc46qaaBbVmMuYXPfgz%2Fuploads%2FpJYd2uwMfDexUlgHU7nJ%2FScreenshot%202026-02-27%20at%202.03.32%E2%80%AFAM.png?alt=media&amp;token=afcbfe4d-d91d-419b-89c6-f8ede2a1fe74" alt=""><figcaption></figcaption></figure>

* **Layers and Spans of Control** — Distribution of managers across org layers and span ranges. Identifies compression (managers with 1–2 reports) and overburdened managers.
* **Headcount Distribution** — Breakdown of headcount by layer, department, location, or any field.
* **Headcount Heatmap** — Two-dimensional view of headcount across any two attributes. Useful for spotting anomalies in org depth.

For the full list, see [Chart Library](/hub/chart-library).

## Navigating Charts

When you first open Workforce Hub, click on any chart tile to view it. After opening a chart, a **chart selector dropdown** appears at the top for switching between charts.

Each chart has consistent controls:

* **Gear icon** — Chart properties, sorting options, axis configuration, and number vs. percentage toggle
* **Filters** — Narrow data to specific departments, locations, or other attributes
* **Table view** — Switch to see underlying data in spreadsheet format
* **Click any bar or segment** — Drill into the specific positions behind that data point

For detailed navigation, see [Chart Navigation](/hub/chart-library).

## Exporting

Download individual charts as **PNG** (images), **PowerPoint** (editable chart objects), or **CSV** (raw data). For multi-chart presentations, see [Slide Packs](/hub/packs).

## Workforce Hub in Scenarios

When you open Workforce Hub inside a scenario, you can toggle between Before and After views to compare your baseline against your proposed changes. This is useful for showing stakeholders the structural impact of a plan.


# Video Tutorials

Visual walkthroughs for Agentnoon basics and advanced workflows

This section brings together Agentnoon’s video library - from short 101 tutorials for new users to advanced feature demos for admins, deployment teams, and power users.

## In This Section

1. [Video Tutorials](/start-here/video-tutorials) - Bite-sized walkthroughs for the core product, including navigation, org chart, Workforce Hub, scenarios, data import, access control, and field management.
2. [Advanced Feature Tutorials](/start-here/video-tutorials/advanced-feature-tutorials) - Deeper demos for advanced workflows such as scenario approvals, automapping, rate cards, monetary attributes in Forecast, scenario compare, and PowerPoint export.

We recommend starting with Video Tutorials first, then moving to Advanced Feature Tutorials once you are comfortable with the basics.


# Video Tutorials

Start here - Agentnoon basics in bite-sized videos

Learn Agentnoon visually with these short tutorial videos. Each video covers a specific feature or workflow in 5-10 minutes.

## Getting Started Videos

### Navigation Basics

Quick overview of Agentnoon's main modules and how to navigate between them.

[Watch: Navigation Basics →](https://www.loom.com/share/86f7a400611a44c0865a31bfa9e4953a?sid=9264011e-5c8f-4ece-a3a2-7d9a806022b6)

**Topics covered:**

* Homepage overview
* Main Org, Scenarios, Forecast, Hub, Directory
* Keyboard shortcuts (1-5)
* Basic navigation patterns

### Org Chart Essentials

Learn how to explore and interact with your organizational chart.

[Watch: Org Chart →](https://www.loom.com/share/8919b970b61a425392d51764a290a630?sid=0e73a687-021a-4b2e-895c-d7e0c1c02be4)

**Topics covered:**

* Card anatomy
* Expanding/collapsing branches
* Search and filtering
* Highlighting by attributes
* Spotlight feature

### Workforce Hub Analytics

Understand how to use pre-built charts to analyze your organization.

[Watch: Workforce Hub →](https://www.loom.com/share/8fe5196a116f42a7b9e6899e14bac5a3?sid=cadc45a3-3f76-4aae-bc18-dce048b5b2c1)

**Topics covered:**

* Navigating between charts
* Customizing axes and filters
* Exporting charts (PNG, PowerPoint, CSV)
* Reading span of control matrices
* Using interactive features

### Scenarios for What-If Planning

Learn how to create and use scenarios to model organizational changes.

[Watch: Scenarios →](https://www.loom.com/share/2fd1bb5d05f346a3b3250f7ccea878cb?sid=787b720f-3522-4a61-b478-436ff2e7571a)

**Topics covered:**

* Creating Full Org vs Partial Org scenarios
* Adding and editing positions
* Moving positions and changing managers
* Using the OpEx Panel
* Closing positions (RIF)

## Admin Videos

### Data Import

Standard import method for organizations.

[Watch: Standard Data Import →](https://www.loom.com/share/c1ea19c6913046968287cf910783886b)

**Topics covered:**

* Field mapping
* Handling nested hierarchies
* Custom attribute configuration
* Troubleshooting common errors

### Partial Upload (power users only)

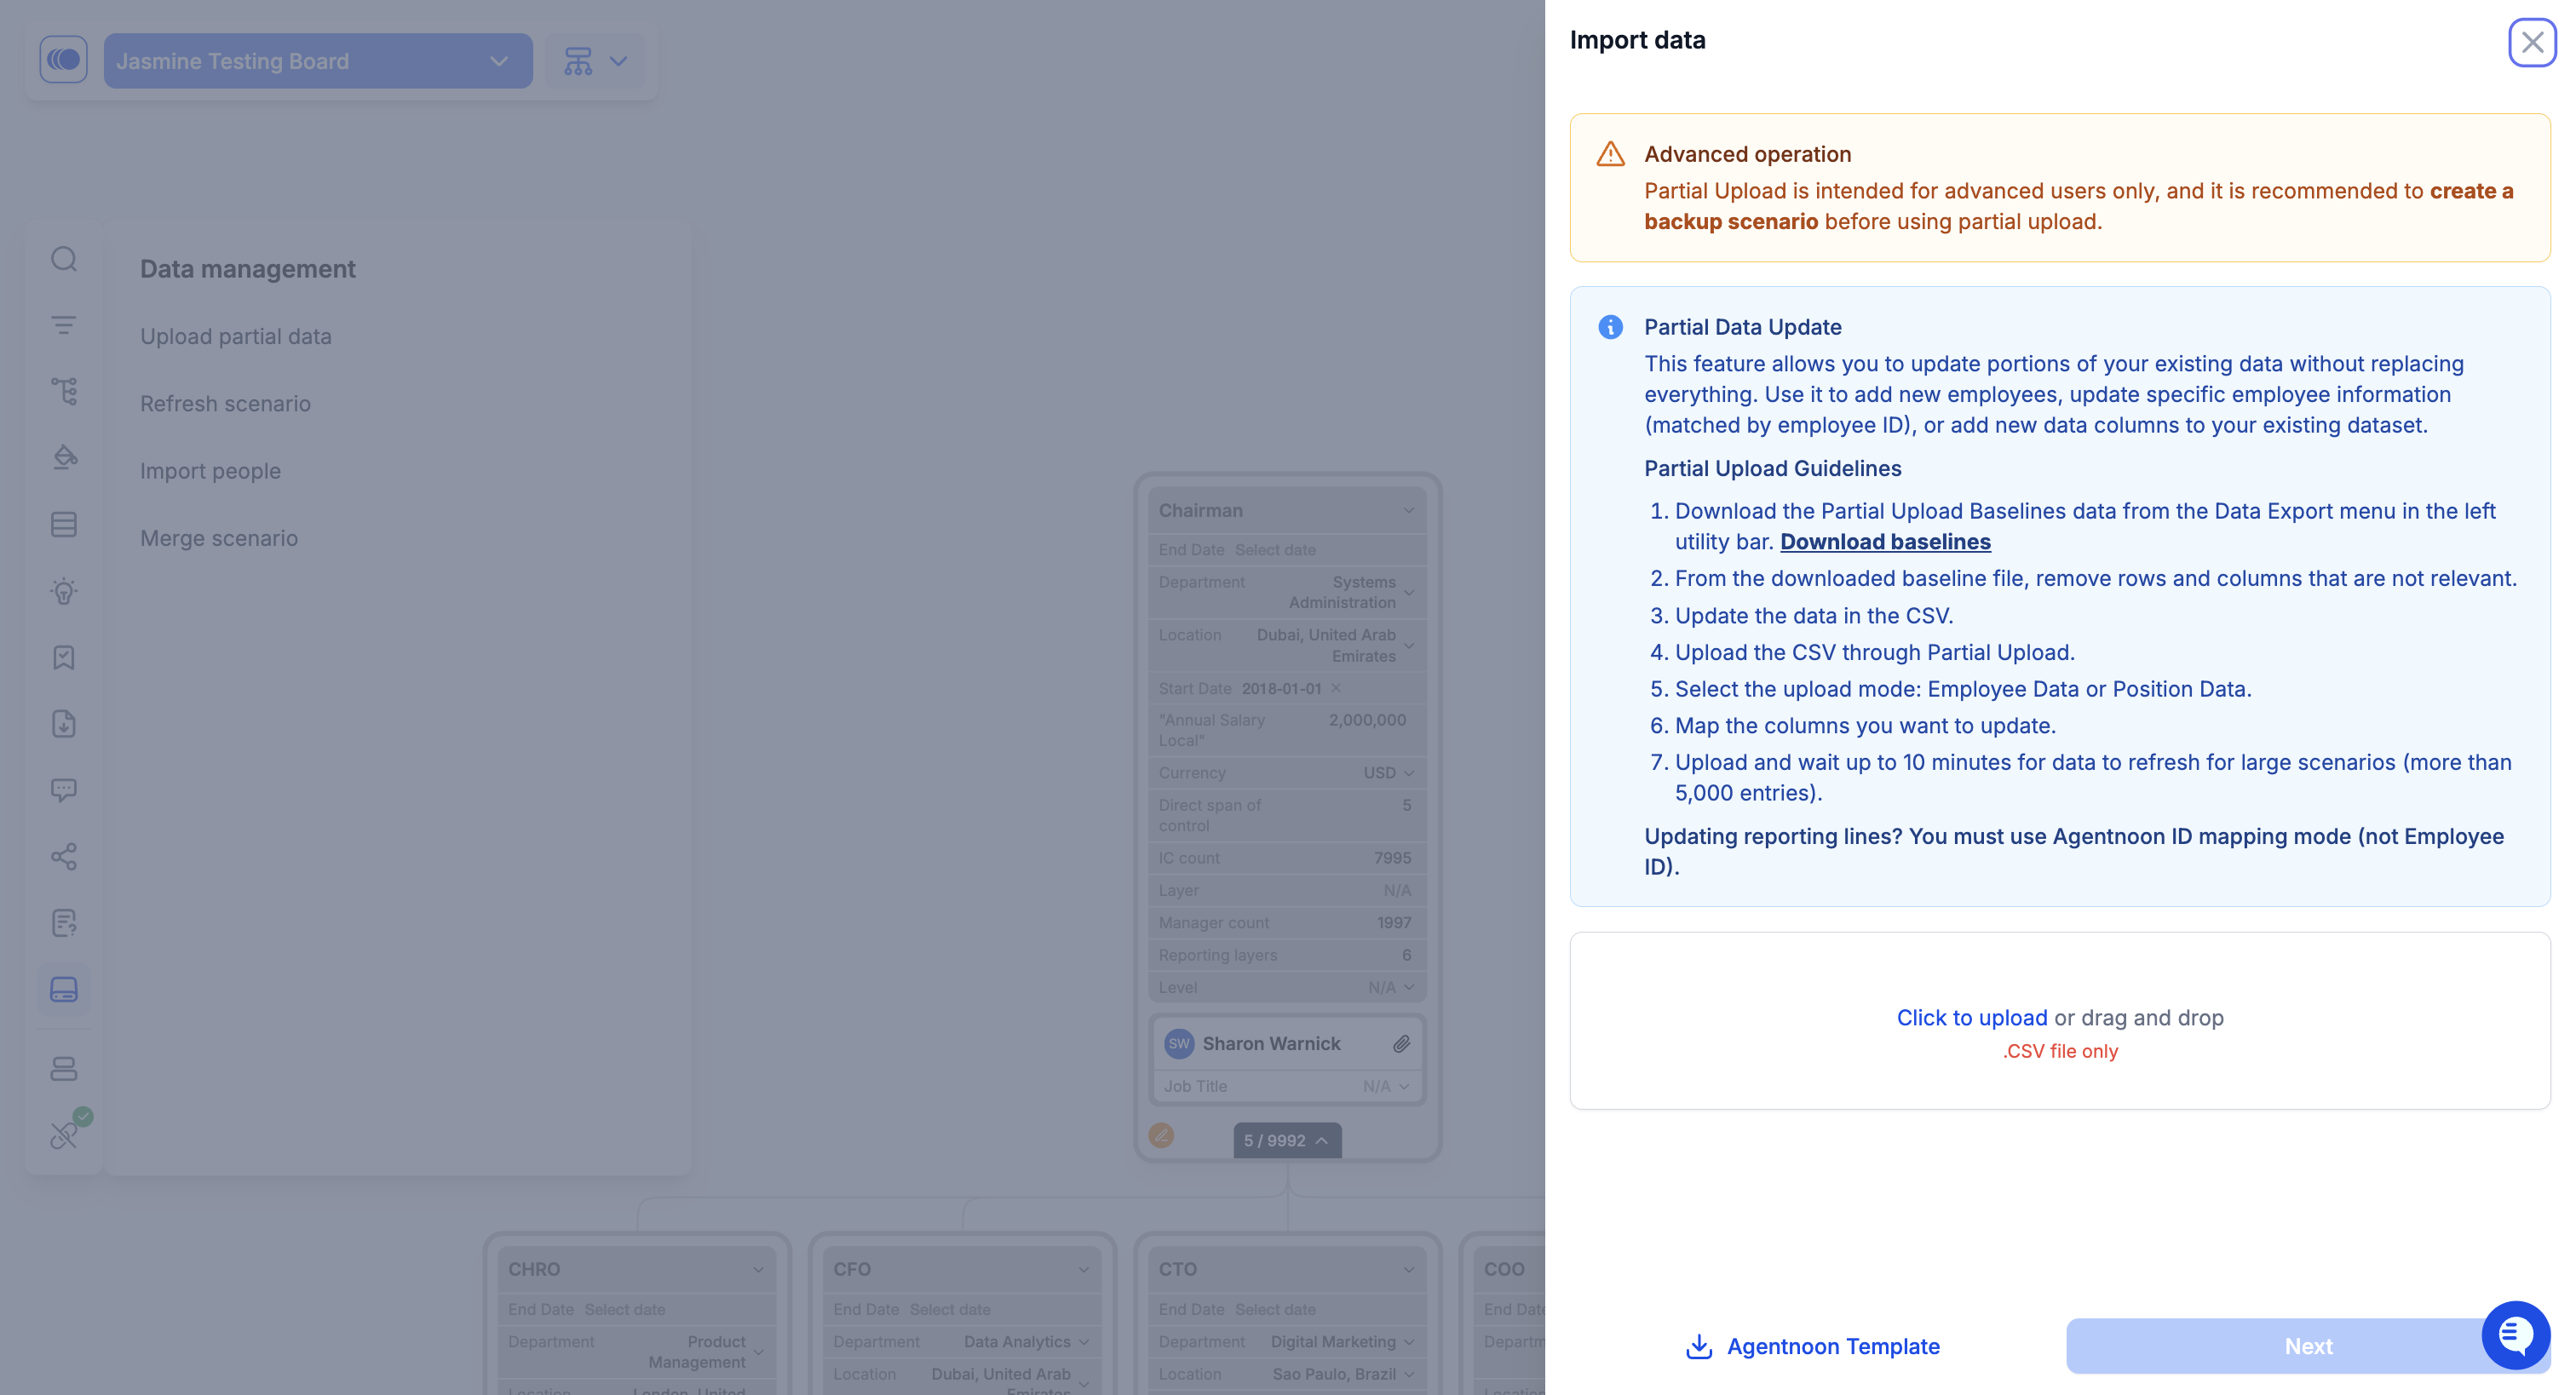
Step-by-step guide to upload partial data to a scenario without overwriting the whole thing.

[Watch: Simplified Data Import →](https://www.loom.com/share/a76e43032b6a4928a4a6d0b813503ba9?sid=a6a5cbb7-f1fa-4fab-8ef1-f3738654dcf6)

**Topics covered:**

* CSV file preparation
* Required vs optional fields
* Mapping columns to Agentnoon fields
* Validation and error handling
* Submitting the import

### Access Control Setup

Learn how to configure user permissions and access groups.

[Watch: Access Control →](https://www.loom.com/share/2de5b02986d9466ab74e810c4f2f2aa6)

**Topics covered:**

* Creating access groups
* Assigning users to groups
* Scoping access by department or leader
* Managing permissions (view, edit, admin)
* Testing access configurations

### Field Management

Customize fields to match your organization's unique needs.

[Watch: Field Management →](https://www.loom.com/share/c0794bd520e24e33a94da85e4306887f)

**Topics covered:**

* Creating custom fields
* Position fields vs People fields
* Configuring dropdown options
* Field visibility settings
* Ordering and grouping fields

## Video Learning Path

**For new users:**

1. Start with **Navigation Basics** (5 min)
2. Watch **Org Chart** (8 min)
3. Explore **Workforce Hub** (7 min)
4. Learn **Scenarios** (10 min)

**Total time:** \~30 minutes to get productive

**For administrators:**

1. Watch all user videos above
2. Then: **Simplified Data Import** (12 min)
3. Then: **Field Management** (9 min)
4. Then: **Access Control** (8 min)

**Total time:** \~60 minutes for full admin onboarding

## Additional Resources

* [Quick Start Guide](/start-here/quick-start-guide) - Get started in 30 minutes
* [Agentnoon 101](/start-here/agentnoon-101) - Core concepts and terminology
* [Support & How to Self-Help](/start-here/support-self-help) - Troubleshooting basics
* [Full Video Library](/reference-guides/video-library) - All videos organized by topic

## Request a Video

Don't see a video for the feature you need? [Contact support](mailto:SupportSWP@dayforce.com) to request a new tutorial video. We create content based on user feedback.


# Advanced Feature Tutorials

Go beyond the 101 library with these advanced walkthroughs for setup, scenario workflows, automapping, forecasting, and exports.

## End-to-End Workflows

#### Scenario Approvals

See the full scenario approval flow from setup through submission, review, and approval.

Watch: [E2E walkthrough of scenario approvals →](https://www.loom.com/share/c063b9a6a5894a8fa049a8ede209e844)

Topics covered: approval setup, submitting scenarios, approver flow, status changes.

### Advanced Configuration Demos

#### Automapping

Learn how automapping works and how field values can be populated based on rules.

Watch: [Demo of automapping →](https://www.loom.com/share/506023ad9a08449e9030f80a6f793595)

Topics covered: rule setup, mapped fields, expected behavior, workflow examples.

#### Rate Card

See how rate cards are configured and used for compensation logic.

Watch: [Demo of rate card →](https://www.loom.com/share/bb749f7945b84376b1300206ad804aa6)

Topics covered: rate card setup, mapping logic, compensation use cases, expected outputs.

### Planning and Analysis Demos

#### Monetary Attributes in Forecast

Learn how monetary fields can be used inside Forecast for cost planning.

Watch: [Demo of monetary attributes in forecast →](https://www.loom.com/share/e38e2509bde44359842e5efcbad0d0ad)

Topics covered: monetary field setup, selecting values in Forecast, comparing cost over time.

#### Scenario Compare

See how to compare scenarios and review differences across planning views.

Watch: [Demo of scenario compare →](https://www.loom.com/share/eba9ace71a5d4a5aa6700e02acc97d22)

Topics covered: compare workflow, reading results, reviewing differences across scenarios.

### Exports and Sharing

#### PowerPoint Export

Learn how to export PowerPoint decks for sharing and presentation.

Watch: [Demo of PowerPoint export →](https://www.loom.com/share/fa976d54570d4d10af1766e9fc7fb2e7)

Topics covered: export flow, generating decks, sharing outputs, presentation-ready exports.


# Support & How to Self-Help

Troubleshooting tips and how to get help when you're stuck

Stuck on something? Here's how to get unstuck quickly!

## 🔧 Common Fixes (Try These First!)

### 1. Refresh the Page

**Most problems are solved by refreshing!**

* Regular refresh: Click your browser's refresh button or press `F5`
* Hard refresh (clears cache): Press `Ctrl + Shift + R` (Windows) or `Cmd + Shift + R` (Mac)

### 2. Check Your Zoom Level

If the interface looks distorted or elements are misaligned:

* Press `Ctrl + 0` (Windows) or `Cmd + 0` (Mac) to reset zoom to 100%
* Agentnoon works best at default zoom levels

### 3. Try a Different Network

Some network-related issues can be resolved by:

* **Disconnecting from VPN** temporarily
* **Switching to a mobile hotspot** to rule out corporate network restrictions
* **Checking with IT** about firewall or whitelisting requirements

### 4. Clear Browser Cache

If data isn't updating or pages won't load:

1. Open browser settings
2. Find "Clear browsing data"
3. Select "Cached images and files"
4. Clear and refresh Agentnoon

## 📚 Search the Documentation

Before reaching out, try searching our help docs:

1. Use the **search bar** at the top of this site
2. Browse by topic in the left navigation
3. Check [**Frequently Asked Questions**](/frequently-asked-questions/overview)
4. Review [**Troubleshooting Guides**](/troubleshooting/overview)

## 🔍 Troubleshooting by Topic

If common fixes don't work, check our detailed troubleshooting guides:

### Can't Log In or Access Agentnoon?

→ [**Login & Access Issues**](/troubleshooting/login-access-issues)

### Data Doesn't Look Right?

→ [**Data Issues**](/troubleshooting/data-issues)

### Problems with Scenarios?

→ [**Scenario Issues**](/troubleshooting/scenario-issues)

### Slow Loading or Timeouts?

→ [**Performance Issues**](/troubleshooting/performance-issues)

### Export or Integration Problems?

→ [**Export & Integration Issues**](/troubleshooting/export-integration-issues)

## 📧 Contact Support

If you've tried troubleshooting and still need help:

### Email Support

<SupportSWP@dayforce.com>

**When emailing, please include:**

* Your organization/instance name
* What you were trying to do
* What happened instead
* Screenshots (if applicable)
* Browser and operating system
* Any error messages you received

### Contact Your Admin

For **faster** response times:

* Reach out to your organization's Agentnoon admin
* They may have immediate solutions or can escalate to support on your behalf

## 💡 Tips for Getting Help Faster

1. **Be specific** - "I can't export" vs. "When I click Export to Excel in the Hub, I get error 500"
2. **Include screenshots** - A picture is worth a thousand words
3. **Note recent changes** - Did this work before? What changed?
4. **Check status** - Visit our status page (if available) for known issues

## 🎓 Learn More

* [Video Tutorials](/start-here/video-tutorials/video-tutorials) - Visual step-by-step guides
* [Agentnoon 101](/start-here/agentnoon-101) - Core concepts explained
* [Quick Start Guide](/start-here/quick-start-guide) - Essential tasks

**Remember:** Most issues are resolved with a simple refresh or zoom reset. Try those first!


# Main Org Overview

Understanding the Main Organization view

Main Org is your current-state organization as it exists today.

It provides a real-time, interactive view of your organizational structure and reflects the data imported from your HRIS or uploaded data source.

Main Org represents your live organizational data — not future plans or what-if scenarios.

**Key characteristics:**

* View-only — You cannot edit Main Org directly
* Synced from your data source — Data comes from your HRIS or imported files
* Single source of truth — All users with access see the same current state
* Baseline for planning — Scenarios are created from Main Org

<figure><img src="https://2094208261-files.gitbook.io/~/files/v0/b/gitbook-x-prod.appspot.com/o/spaces%2FCZc46qaaBbVmMuYXPfgz%2Fuploads%2FlzikaiDw66TTcQsZzcDm%2FScreenshot%202026-02-26%20at%2010.06.36%E2%80%AFAM.png?alt=media&amp;token=6a08eb88-0de8-4225-b347-a407177bfbee" alt=""><figcaption></figcaption></figure>

## Main Org vs. Scenarios

| Main Org         | Scenarios              |
| ---------------- | ---------------------- |
| Current state    | Future state / what-if |
| View-only        | Fully editable         |
| One version      | Unlimited versions     |
| Synced from HRIS | Manually created       |
| Real-time data   | Point-in-time snapshot |

**When to use Main Org:** When you need to explore, search, analyze, or understand your current organization.

**When to use Scenarios:** When you need to model changes, plan reorganizations, or test different structures.

## Main Org as Baseline for Scenarios

Every Scenario begins as a copy of Main Org at the time it is created.

* Scenarios capture a point-in-time snapshot of Main Org.
* Changes made in Main Org after a Scenario is created do not automatically update that Scenario.
* In a Scenario, **Show Before** references the original Main Org snapshot.
* **Show After** reflects the proposed changes within the Scenario.

If Main Org has changed and you need to align your planning work, use **Scenario Refresh** to rebase the Scenario on the current Main Org.

## Main Org Views

* **Org Chart** — Visual hierarchy showing reporting relationships
* **Directory** — Table view with sortable columns for bulk analysis
* **Forecast** — Time-based projections of current organization
* **Workforce Hub** — Analytics charts for structure analysis

<figure><img src="https://2094208261-files.gitbook.io/~/files/v0/b/gitbook-x-prod.appspot.com/o/spaces%2FCZc46qaaBbVmMuYXPfgz%2Fuploads%2F54CvgNJvDPlgPfM54NdF%2FScreenshot%202026-02-26%20at%2010.08.06%E2%80%AFAM.png?alt=media&amp;token=67bc0ef3-7f78-4942-a321-1dc9d883bc1b" alt=""><figcaption></figcaption></figure>

## What You Can Do in Main Org

Although Main Org is view-only, it supports exploration and analysis of your current organization.

#### Explore the Organization

* Navigate the hierarchy by expanding or collapsing reporting lines
* Zoom and pan across the org chart
* Switch between vertical, horizontal, or compact layouts
* Adjust display levels to show 1–3 levels at a time

#### Search and Filter

* Search by name or job title
* Filter by attributes such as department, location, or pay grade
* Use Manager Filtering to preserve reporting context
* Combine multiple filters to narrow your view

#### Highlight and Analyze

* Color-code positions by attributes such as department, location, or pay grade
* Use legends and outlines to add visual context or a second highlight dimension
* Customize color schemes (configured by administrators)
* Apply Spotlight rules to identify positions that meet specific criteria, including pre-built rules and custom attributes

#### Customize and Save Views

* Add, remove, or reorder fields displayed on position cards
* Include calculated fields such as Span of Control or Layer
* Save configured views for quick access later

#### Export and Switch Views

* Export the org chart as JPEG or PowerPoint
* Export filtered data as CSV
* Switch to Directory view for table-based analysis

## Common Workflows

#### Exploring the Organization

1. Open Main Org.
2. Navigate to the area of interest using search, filters, or hierarchy navigation.
3. Customize your view using highlights or card content as needed.
4. Save a view if you plan to revisit it.

#### Analyzing Span of Control

1. Open Main Org.
2. Apply Spotlight using span of control criteria.
3. Review highlighted positions.
4. Create a Scenario if structural changes are required.

#### Preparing for a Stakeholder Meeting

1. Filter to the relevant department or team.
2. Highlight by a key attribute (for example, location or pay grade).
3. Export the org chart or data for presentation.

## Data Source and Refresh

#### Initial Import

Data can be loaded to the Main Org from:&#x20;

* HRIS integrations (for example, Dayforce, Workday, BambooHR, ADP, Rippling, etc.)
* CSV or Excel files
* API integrations&#x20;

#### Ongoing Sync

Main Org may be refreshed through:

* Scheduled syncs (daily or weekly)
* Manual uploads
* Real-time integrations (if configured)

Refresh frequency depends on your organization’s integration setup.

**Important** — Updates to Main Org do **not** automatically flow into existing scenarios.

Each scenario captures a snapshot of Main Org at the time it is created.

To apply approved changes:

1. Model changes in a scenario.
2. Submit for approval.
3. Implement changes in your HRIS.
4. Refresh data so updates appear in Main Org.

## Access and Permissions

Your view of Main Org depends on your assigned Access Group.

Some users may see the entire organization, while others may only see specific departments or teams.

If you need access to additional areas, contact your administrator.

## Best Practices

* Start here first - Always explore Main Org before creating scenarios
* Use filters strategically - Manager filtering preserves hierarchy better than standard filtering
* Save useful presets - Create saved views for departments you analyze frequently
* Check your scope - Know what parts of the org you have access to
* Understand data freshness - Know when your data last synced from HRIS
* Don't forget to clear filters - Active filters carry over to other modules

## Limitations

Main Org is view-only, so you cannot:

* Add or delete positions
* Move people between positions
* Edit attributes (salary, title, department, etc.)
* Model future changes
* See historical views (Main Org always shows current state)

To make changes, create a Scenario.

## Next Steps

* Learn [how to navigate Main Org](/main-org/navigation) in detail
* Understand the [Toolbar actions](/main-org/navigation) available
* Explore [Directory View](/directory/overview) for table-based analysis
* See [Org Metrics & Insights](/main-org/metrics-insights) for calculated fields
* Create your first [Scenario](/scenarios/creating-scenarios) to model changes


# Orientation & Navigation

How to navigate and explore the org chart, and available toolbar tools

The left toolbar provides all navigation and analysis tools in Main Org. All actions are **view-only** — to make changes to positions, create a Scenario.

<figure><img src="https://2094208261-files.gitbook.io/~/files/v0/b/gitbook-x-prod.appspot.com/o/spaces%2FCZc46qaaBbVmMuYXPfgz%2Fuploads%2FGL7YwdnUTth20GqzJTA5%2FScreenshot%202026-02-27%20at%202.08.06%E2%80%AFAM.png?alt=media&amp;token=644b86e3-d58b-4d7d-a32d-4c86a25484bf" alt=""><figcaption></figcaption></figure>

## Toolbar Tools

#### **Search (🔍)**

Find employees or positions by name or job title.&#x20;

* Results navigate the org chart to that position.
* Works across your accessible scope.
* Shortcut: Cmd/Ctrl+K or `/`.

#### **Filter**

Show only positions matching specific criteria (for example, Department, Location, Pay Grade, or custom fields).

Two filter modes are available:

1. Standard Filtering — Shows only matching positions and may break visual hierarchy.
2. Manager Filtering (reccomended) — Preserves reporting context by keeping managers visible above matching positions.

Filters persist across Org Chart, Directory, and Forecast views.

Use **Clear All** to reset filters.

#### **Tree View**

Displays the organization as an indented list. Use Tree View to quickly navigate deep hierarchies without expanding cards manually.

#### **Highlight**

Color-code positions by any attribute.

* Use **Fill Color** to apply one attribute.
* Use **Outline Color** to apply a second attribute.
* Toggle the legend to see what each color represents.

Highlighting does not change data — it is a visual tool for analysis.

#### **Card Content**

Control which fields appear on position cards.

* Add standard, custom or calculated fields
* Drag and drop to reorder fields.
* Changes apply immeditely.&#x20;

:bulb: Keep cards minimal — 3–5 fields for readability; add more only for specific analysis.

#### **Spotlight**

Dim non-matching positions to focus on specific criteria.

* Apply preconfigured rules (for example, span of control ranges)
* Spotlight by any available attribute, including custom fields
* Matching positions are highlighted; others appear dimmed

Spotlight helps identify patterns within the organization.

#### **Presets (Saved Views)**

Save your current configuration of: Filters, Highlights and Card Content. Saved views can be reloaded later and may be available to other users based on permissions.

<figure><img src="https://2094208261-files.gitbook.io/~/files/v0/b/gitbook-x-prod.appspot.com/o/spaces%2FCZc46qaaBbVmMuYXPfgz%2Fuploads%2F0iEJXtPwctA0glEWCGIv%2FScreenshot%202026-02-24%20at%202.28.32%E2%80%AFPM.png?alt=media&amp;token=c156fe1f-b081-48bd-bb0a-138a0eb64037" alt=""><figcaption></figcaption></figure>

<figure><img src="https://2094208261-files.gitbook.io/~/files/v0/b/gitbook-x-prod.appspot.com/o/spaces%2FCZc46qaaBbVmMuYXPfgz%2Fuploads%2FOjuZlqfxbN3OkXupjKBD%2FScreenshot%202026-02-24%20at%202.29.09%E2%80%AFPM.png?alt=media&amp;token=fce9aeb9-fbd0-4571-82b1-644fec84ab5b" alt=""><figcaption></figcaption></figure>

#### **Export**

Export your current view as:

* JPEG (images)
* PowerPoint (one slide per manager, configurable depth)
* CSV (all data, respects active filters and visible columns
* Template builder (admin only)

#### **Layout**

Switch between layout options:

* Vertical
* Horizontal
* Compact

Adjust how many levels are expanded (1–3 levels). Use zoom and pan controls to navigate large structures.

**Directory Toggle**

Switch to Directory view to analyze data in a table format.

#### Keyboard Shortcuts

`1` = Main Or

`5` = Directory

`/` or Cmd/Ctrl+K = Search

Esc = Close panels

#### Available Actions: Main Org vs. Scenarios

| Tool                                                               | Main Org | Scenarios |
| ------------------------------------------------------------------ | -------- | --------- |
| Search, Filter, Highlight, Spotlight, Card Content, Export, Layout | ✅        | ✅         |
| Add/Edit/Move/Close positions                                      | ❌        | ✅         |
| Bulk Operations                                                    | ❌        | ✅         |
| OpEx Panel                                                         | ❌        | ✅         |
| Comments                                                           | ❌        | ✅         |
| Approvals                                                          | ❌        | ✅         |

## Related Articles

* [Directory View](https://github.com/Productao/gitbook/blob/docs/help-center-refresh-2026/main-org/directory-view.md)
* [Org Metrics & Insights](/main-org/metrics-insights)
* [Creating a Scenario](/scenarios/creating-scenarios)


# Org Metrics & Insights

Understanding organizational health metrics

Agentnoon automatically calculates organizational metrics (marked **“**&#x46;X” for formula-based) that update in real time. You can view these metrics:

* On org chart cards (via Card Content)
* In Directory columns
* In Workforce Hub charts
* In exports

These metrics are calculated from your current organizational data and refresh when Main Org data is updated.

## Span of Control (SOC) Metrics

| Metric                                                      | Calculation                                                             | Use It For                                             |
| ----------------------------------------------------------- | ----------------------------------------------------------------------- | ------------------------------------------------------ |
| **Direct SOC**                                              | Count of direct reports                                                 | Assessing manager's immediate supervisory load         |
| **Average Direct Manager SOC** (formerly Avg Immediate SOC) | Avg Direct SOC of managers who report to this position                  | Assessing whether the next-level managers are balanced |
| **Average Hierarchical SOC** (formerly Avg Total SOC)       | Avg Direct SOC of all managers in the hierarchy below (excluding focal) | Overall management density under a leader              |
| **Average Managerial SOC** (new)                            | Avg Direct SOC of all managers including focal position                 | Average reports-per-manager across the full hierarchy  |

**Direct SOC benchmarks:** Optimal: 5–9 for most roles; Executives: 5–7; Frontline managers: 7–15 (depends on role complexity).

## Other Key Metrics

**Total Organization Size** — All positions under a manager (direct + all indirect). Measures scope of responsibility.

**Layer / Level** — Distance from CEO (CEO = Layer 1, direct reports = Layer 2, etc.). Measures org depth.

**Layer benchmarks:** <500 employees: 4–5 layers; 500–5,000: 5–7; >5,000: 6–9. More than 8–10 layers suggests potential inefficiency.

## Calculated Metrics Reference

All metrics marked **FX** are automatically calculated by Agentnoon and update in real-time as the org changes.

| Metric                     | Definition                                                          | Usage / Note                                                                      |
| -------------------------- | ------------------------------------------------------------------- | --------------------------------------------------------------------------------- |
| **IC Cost**                | Total cost of all individual contributors (non-managers)            | Budgeting and comparing investment in non-managerial personnel across departments |
| **IC Count**               | Total number of individual contributors                             | Understanding workforce scale excluding managerial roles                          |
| **Layers**                 | Hierarchical level a position occupies (CEO = Layer 1)              | Provides clarity on org structure depth                                           |
| **Manager Cost**           | Total cost of managerial positions                                  | Assess leadership investment compared to overall org                              |
| **Manager Count**          | Number of managers                                                  | Leadership density across different parts of the org                              |
| **Manager Cost Ratio**     | Proportion of total cost attributed to managers                     | Identifies how much of org expenses go to management                              |
| **Manager to IC Ratio**    | Managers per individual contributor (e.g., 5:1)                     | Key metric for org efficiency and leadership distribution                         |
| **Rate Card**              | Attributes used to auto-populate salary from compensation/rate card | Streamlines applying standard salary metrics to positions                         |
| **Total Cost**             | Sum of all costs (ICs + managers)                                   | Complete financial overview for budgeting                                         |
| **Total Count**            | Total headcount including ICs and managers                          | Used for per-employee metrics and scale evaluation                                |
| **Reporting Layers**       | Number of layers below a specific person                            | Understand depth of reporting and managerial span                                 |
| **Average Salary**         | Average salary across all positions in scope                        | Benchmarking compensation trends and identifying outliers                         |
| **Average Manager Salary** | Average salary of managerial positions                              | Evaluate leadership compensation vs overall costs                                 |
| **Average IC Salary**      | Average salary of individual contributors                           | Assess pay equity and workforce cost structure                                    |
| **IC Cost Ratio**          | Proportion of total cost attributed to ICs                          | Understand investment in non-managerial roles vs managers                         |
| **1:1 Managers Ratio**     | Proportion of managers who directly manage only one report          | Highlights potential inefficiencies or top-heavy structures                       |

## Using Metrics for Analysis

**Find compression (too-narrow spans):**

1. Workforce Hub > Layers and Spans chart > look for high counts in the 1–2 SOC column
2. Or: Main Org > Spotlight > Direct SOC = 1–2

**Find deep hierarchies:**

1. Workforce Hub > Headcount Heatmap > X = Department, Y = Layers
2. Compare depths across departments

**Find overburdened managers:**

* Spotlight > Direct SOC = 16–25; evaluate context before acting

## Adding Metrics to Views

**On org chart cards:** Card Content (toolbar) > scroll to FX metrics > check boxes. Don't add too many — cards become cluttered.

**In Directory:** Column settings > add calculated metric columns > sort high-to-low to find outliers.

**In Workforce Hub:** Metrics power the Layers & Spans and Heatmap charts automatically.

## Things to Review

* 30% of managers with Direct SOC of 1–2 → potential compression
* Direct SOC >20 without clear justification → potentially overburdened
* Inconsistent spans across similar roles → structural inconsistency
* 8 layers in a company <5,000 employees → potentially inefficient hierarchy

## Important Caveat

Metrics are indicators, not mandates. Investigate context before taking action. A Direct SOC of 2 may be appropriate for a senior architect with strategic responsibilities; a Direct SOC of 20 may be fine for a standardized call center team.

## Related Resources

* [Span of Control Analysis Tutorial](/reference-guides/overview/span-of-control-analysis)
* [Layers and Spans Chart](/hub/layers-spans-chart)
* [Workforce Hub Overview](/hub/overview)


# Exporting Data

Exporting data and visuals from Main Org

You can export organizational data and visuals from Main Org for reporting, analysis, and presentations.

Exports reflect your current view, including active filters and visible columns.

## Export Formats

#### Visual Exports

* **JPEG** — screenshot of the current org chart view
* **PowerPoint** — A structured org chart with configurable depth and layout

#### Data Exports

* **CSV** — Raw position and employee data
* **Excel** — Formatted spreadsheet export
* **EIB File** — Workday Enterprise Interface Builder format (admin only)
* **Template Exports** — Admin-configured export templates

## How to Export

1. Navigate to Main Org.
2. Apply filters if you want to export a subset of data.
3. Click **Export**.
4. Select your preferred format.
5. Configure export options (if applicable).
6. Download the file.

<figure><img src="https://2094208261-files.gitbook.io/~/files/v0/b/gitbook-x-prod.appspot.com/o/spaces%2FCZc46qaaBbVmMuYXPfgz%2Fuploads%2FSepOvHAZPfwwsosAxakx%2FScreenshot%202026-02-27%20at%202.14.25%E2%80%AFAM.png?alt=media&amp;token=0b1d6312-1512-430c-805b-c67c0ff7f633" alt=""><figcaption></figcaption></figure>

### PowerPoint Configuration

When exporting to PowerPoint, you can configure:

* Filters (department, location, etc.)
* Hierarchy depth
* Layout (vertical, horizontal, compact)
* Slide depth (layers per slide)
* Card content (titles only or full details)

Each manager with direct reports appears on a separate slide.

**Note:** If the report contains a large volume of data, the export may not generate immediately. In such cases, you will see a notification (as shown in the screenshot) indicating that the file is being processed. Once the PowerPoint file is ready, you will receive an email with access to download the exported file.

<figure><img src="https://2094208261-files.gitbook.io/~/files/v0/b/gitbook-x-prod.appspot.com/o/spaces%2FCZc46qaaBbVmMuYXPfgz%2Fuploads%2FlRFGslfDEOi8qeDgWyY4%2Fimage.png?alt=media&amp;token=d3777698-6db5-4662-bae5-31840d2f1f05" alt=""><figcaption></figcaption></figure>

<figure><img src="https://2094208261-files.gitbook.io/~/files/v0/b/gitbook-x-prod.appspot.com/o/spaces%2FCZc46qaaBbVmMuYXPfgz%2Fuploads%2FsRfVFHqgvtZe2DAsGvdC%2Fimage.png?alt=media&amp;token=e25c4065-b766-42a0-a186-73545a3d3213" alt=""><figcaption></figcaption></figure>

### Exporting from Directory&#x20;

For structured data control:

1. Switch to **Directory** view.
2. Select which columns to display.
3. Reorder columns if needed.
4. Apply filters.
5. Click **Export** and choose CSV.

<figure><img src="https://2094208261-files.gitbook.io/~/files/v0/b/gitbook-x-prod.appspot.com/o/spaces%2FCZc46qaaBbVmMuYXPfgz%2Fuploads%2Fo6PzNUYUJ5IGHTHVz7jB%2FScreenshot%202026-02-27%20at%202.15.49%E2%80%AFAM.png?alt=media&amp;token=7fea92cb-6bb0-4bb3-b1b1-1df9e3cd7a9a" alt=""><figcaption></figcaption></figure>

Exports include visible columns and respect active filters.

**Saved Reports:** After configuring columns and order, click **Save Report** to save this configuration. Access saved reports from the Reports dropdown for consistent recurring exports.

**Note:** Directory exports are less commonly used. Most users prefer PowerPoint org charts or Workforce Hub analytics for stakeholder presentations.

### Exporting from Forecast&#x20;

In Forecast view, you can export projection tables:

1. Configure the row aggregator, time period (Monthly, Quarterly, or Yearly), and metric (Headcount or Cost).
2. Click **Export**.
3. Download the table showing projected headcount or cost by time period.

<figure><img src="https://2094208261-files.gitbook.io/~/files/v0/b/gitbook-x-prod.appspot.com/o/spaces%2FCZc46qaaBbVmMuYXPfgz%2Fuploads%2FCDyuY25yGTv6QjoqxEzZ%2FScreenshot%202026-02-27%20at%202.17.19%E2%80%AFAM.png?alt=media&amp;token=bb693415-0d98-4787-9ce9-3b9066017c26" alt=""><figcaption></figcaption></figure>

Forecast exports reflect effective dates and hire dates used in scenarios.

**Learn more:** [Forecast Reports & Exports](/forecast/overview)

### Exporting from Workforce Hub&#x20;

From Workforce Hub, you can export charts and underlying data:

* **PNG** — Export the chart as an image.
* **PowerPoint** — Export the chart as an editable slide.
* **CSV** — Export the underlying chart data (via table view).

For multi-chart presentations, use Slide Packs to generate a PowerPoint with multiple charts

**Learn more:** [Slide Packs](/hub/packs)

<figure><img src="https://2094208261-files.gitbook.io/~/files/v0/b/gitbook-x-prod.appspot.com/o/spaces%2FCZc46qaaBbVmMuYXPfgz%2Fuploads%2FquJDHOjdFMco1reognYM%2FScreenshot%202026-02-27%20at%202.19.25%E2%80%AFAM.png?alt=media&amp;token=b806f275-b234-4100-a69d-d5bfdf86bd04" alt=""><figcaption></figcaption></figure>

## Permissions

Exports respect your assigned Access Group.

You can only export data that you have permission to view. Fields restricted by your access scope will not appear in exported files. EIB exports are typically restricted to admins and HRIS teams.

## Troubleshooting

<table><thead><tr><th width="332.578125">Problem</th><th>Solution</th></tr></thead><tbody><tr><td>Export button unavailable</td><td>Verify export permissions with your administrator.</td></tr><tr><td>Empty file</td><td>Remove restrictive filters and try again.</td></tr><tr><td>Slow export</td><td>Filter to a smaller subset before exporting.</td></tr><tr><td>Missing columns</td><td>Confirm columns are visible before exporting. </td></tr></tbody></table>

**More help:** [Export & Integration Issues](/troubleshooting/export-integration-issues)

## Related Articles

* [Directory Exporting & Reporting](/directory/exporting-reporting)
* [Forecast Reports & Exports](/forecast/overview)
* [Scenario Exporting](/scenarios/exporting)


# Scenarios Overview

Introduction to scenario planning

## What Is a Scenario?

Scenarios are editable copies of your organization used for planning future changes.

Each Scenario begins as a snapshot of Main Org at the time it is created. Changes made in a Scenario do not affect Main Org.

Use Scenarios to model reorganizations, hiring plans, budget adjustments, and structural changes before implementing them.

## Three Scenario Types

When creating a Scenario, you can choose the type that matches your scope and purpose:

1. **Partial Org (recommended)** - Includes a selected portion of the organization, such as a department or reporting line. Best for focused changes within a specific team or area.
2. **Full Org** - Includes your entire accessible organization. Best for company-wide planning or large-scale restructuring.
3. **New Org** - Starts with a blank structure. Best for designing a new department from scratch.

<figure><img src="https://2094208261-files.gitbook.io/~/files/v0/b/gitbook-x-prod.appspot.com/o/spaces%2FCZc46qaaBbVmMuYXPfgz%2Fuploads%2Fe23UyOWrTgMMryDB17AC%2FScreenshot%202026-03-04%20at%2010.42.38%E2%80%AFAM.png?alt=media&amp;token=3382784a-7dc2-4b3c-ad98-858b35f56156" alt=""><figcaption></figcaption></figure>

## The Scenario Lifecycle

A Scenario typically moves through the following stages:

* **Create** - Generate a Scenario from Main Org.
* **Model** - Make structural and data changes.
* **Analyze** - Review headcount and cost impact.
* **Compare** - Evaluate alternative Scenarios.
* **Collaborate** - Share and gather feedback.
* **Approve** - Submit the Scenario for review.
* **Implement** - Apply approved changes in your Org.

## Key Features

#### OpEx Panel (Impact Tracking)

Track the impact of your changes in real time.

The OpEx Panel summarizes:

* Additions
* Reductions
* Data changes
* Headcount impact
* Cost impact

Use it to monitor the overall effect of your proposed changes.

#### Time-Based Planning

Model changes using effective dates.

Plan hires, exits, or structural updates over time and evaluate headcount and cost projections accordingly.

#### Scenario Comparison

Compare multiple Scenarios to evaluate different planning approaches.

Review differences in headcount, cost, structure, and key metrics before selecting a preferred option.

#### Approval Workflows

Submit Scenarios for formal review, including routing them through multi-level approvers while maintaining a full audit trail of all changes.&#x20;

## Scenarios vs. Main Org

| Scenarios              | Main Org         |
| ---------------------- | ---------------- |
| Future state / what-if | Current state    |
| Fully editable         | View-only        |
| Unlimited versions     | One version      |
| Manually created       | Synced from HRIS |
| Point-in-time snapshot | Real-time data   |

**When to use Main Org:** When you need to explore, search, analyze, or understand your current organization.

**When to use Scenarios:** When you need to model changes, plan reorganizations, or test different structures.

## Getting Started

1. Main Org > **Create Scenario** (top right) or Homepage > "**+"** button
2. Choose Partial Org > select scope
3. Name clearly: For example, "Engineering Q2 2026 Reorg"
4. Start editing — see [Making Position Changes](/scenarios/using-scenarios-basics/making-position-changes)
5. Check the OpEx Panel frequently for insights

## Related Articles

* [Creating Scenarios](/scenarios/creating-scenarios)
* [Using Scenarios - Basics](/scenarios/using-scenarios-basics)
* [Making Position Changes](/scenarios/using-scenarios-basics/making-position-changes)


# Key Concepts for Scenarios

Essential concepts for working with scenarios

## What Is a Scenario?

An editable copy of your Main Org where you model future changes without affecting the current live data. Changes in scenarios are completely isolated from Main Org until you choose to implement them.

**Typical workflow:** Main Org (current state) → Create scenario → Model changes → Review impact → Submit for approval → Implement

## Change Types

**Addition (green outline)** - New position created; increases headcount and cost.

**Reduction (red outline)** - Existing position closed; decreases headcount and cost. Types: RIF and Exits.

**Modification (icon only, no color)** - Changed attributes on existing position (title, salary, department, manager). May increase or decrease cost.

**No Change** - Position exists in both the Main Org and scenario; no attributes modified.

<figure><img src="https://2094208261-files.gitbook.io/~/files/v0/b/gitbook-x-prod.appspot.com/o/spaces%2FCZc46qaaBbVmMuYXPfgz%2Fuploads%2FTNkodulwgRN7VBuJmqdp%2Fimage.png?alt=media&amp;token=7c1b904b-016e-4454-a594-eda344888207" alt=""><figcaption></figcaption></figure>

## Before / After / Changes Views

* **Show Before** - Main Org (current reality); your baseline
* **Show After** - All scenario changes applied; the proposed future state
* **Show Changes** - Delta only; shows +/- per department; best for communicating impact

## OpEx Panel (Scenario Changes & Impact)

The OpEx Panel is the side panel where you review all scenario changes and their impact. It shows headcount additions and reductions, net headcount change, net cost impact, and breakdown by department. You can toggle between cost and headcount views, and see changes grouped by effective date. The OpEx Panel is also where you submit scenarios for approval. See [Scenario Changes & Impact](/scenarios/opex-panel).

## Effective Dates

Date when a planned change takes effect. Set different dates on different changes in the same scenario to model phased rollouts. Forecast shows the time-phased impact. See [Time-Based Planning](/scenarios/time-based-planning).

## The Bench

Holding area for employees detached from positions but not yet placed elsewhere. Useful for modeling internal transfers: detach from Position A → assign to Position B. The bench is a planning construct only.

## Scenario Views

* **Org Chart** - Visual hierarchy; drag-and-drop; best for structural changes
* **Directory** - Table view; bulk operations; best for mass edits and filtering
* **Forecast** - Time-phased projections; headcount/cost by period
* **Workforce Hub** - Analytics charts (SOC, distribution, heatmap); before/after comparison

<figure><img src="https://2094208261-files.gitbook.io/~/files/v0/b/gitbook-x-prod.appspot.com/o/spaces%2FCZc46qaaBbVmMuYXPfgz%2Fuploads%2FMJNGTYZLZ8NwbDpaJctt%2FScreenshot%202026-03-04%20at%2010.47.15%E2%80%AFAM.png?alt=media&amp;token=f3d9205b-dc7f-4e56-afc6-781eecd80dbc" alt=""><figcaption></figcaption></figure>

## Approval States

Draft (editable) → Submitted/Pending (locked) → Approved (locked) → Rejected (editable for revisions). Once approved, scenarios lock to preserve the approved state.

<figure><img src="https://2094208261-files.gitbook.io/~/files/v0/b/gitbook-x-prod.appspot.com/o/spaces%2FCZc46qaaBbVmMuYXPfgz%2Fuploads%2FA1O5S2LOIhx9NPYvQzzS%2FScreenshot%202026-03-04%20at%2010.57.53%E2%80%AFAM.png?alt=media&amp;token=a27ca150-2cff-4f1a-af4e-1269a2a7bdd9" alt=""><figcaption></figcaption></figure>

<figure><img src="https://2094208261-files.gitbook.io/~/files/v0/b/gitbook-x-prod.appspot.com/o/spaces%2FCZc46qaaBbVmMuYXPfgz%2Fuploads%2FiCMgEsUE7c01BBZwPZik%2FScreenshot%202026-03-04%20at%2010.59.47%E2%80%AFAM.png?alt=media&amp;token=7a5fa2a7-d74e-441d-be34-2bb32519775c" alt=""><figcaption></figcaption></figure>

## Scenario Comparisons

Compare 2 scenarios side-by-side: cost, headcount, structure, org health metrics. Create Option A and Option B and use comparisons to choose the best approach for leadership. Comparisons must be started from the homepage.

<figure><img src="https://2094208261-files.gitbook.io/~/files/v0/b/gitbook-x-prod.appspot.com/o/spaces%2FCZc46qaaBbVmMuYXPfgz%2Fuploads%2FQRxkO9GKUcZVnHo17vSU%2FScreenshot%202026-03-04%20at%2010.56.07%E2%80%AFAM.png?alt=media&amp;token=563facc7-7cfd-49c4-838a-dff29bfbbfed" alt=""><figcaption></figcaption></figure>

## Projects (Optional)

Group related scenarios under a project for larger initiatives. Example: "2026 Restructuring" project containing Engineering Reorg, Sales Consolidation, and G\&A Cost Reduction scenarios.

**Note:** Projects are being retired soon and may not be available in a future release. Avoid relying on projects for new scenario setup.

## Related Articles

* [Scenarios Overview](/scenarios/overview)
* [Creating Scenarios](/scenarios/creating-scenarios)
* [Time-Based Planning](/scenarios/time-based-planning)
* [Scenario Comparisons](/scenarios/comparisons)
* [Scenario Approvals](/scenarios/approvals)


# Orientation & Navigation

Finding your way around scenarios

## Interface Layout

When you open a scenario, you'll see:

* **Main content area:** Org chart, directory, forecast, or hub depending on the selected view
* **Top toolbar:** Switching scenarios
* **Side toolbar:** Search, filters, Highlight, Spotlight, Views, Export, Share, Activity log
* **OpEx Panel panel:** Real-time impact display (toggle with the 👀 icon)

## Modules

Switch modules using the dropdown in the toolbar (or keyboard shortcuts):

| View              | Use for                                            | Keyboard Shortcut |
| ----------------- | -------------------------------------------------- | ----------------- |
| Org Chart         | Drag-and-drop reorgs, visualizing structure        | 1                 |
| Directory         | Bulk edits, filtering and analysis                 | 2                 |
| Forecast          | Time-based planning, seeing phased changes         | 3                 |
| Workforce Hub     | Validating org health, before/after analytics      | 4                 |
| Activity Analysis | Identifying key processes and allocating resources | 5                 |

## Before / After / Changes Toggle

* **Show After** - Working mode: see results as you make changes
* **Show Changes** - Review mode: see only what's different from baseline (i.e., the Main Org data)
* **Show Before** - Reference mode: current state data (i.e., the Main Org data)

## Toolbar Tools

**Available in Main Org and Scenarios:**

* **Search** - Find by name, position title, position id, and agentnoon id
* **Filter** -Show only positions matching criteria (department, location, salary range, custom fields)
* **Highlight** - Color-code cards by attribute (e.g., "Project" to visually scan positions working on different projects)
* **Card Content** - Control which fields appear on position cards
* **Spotlight** - Color selected positions (through a criteria) to focus attention when presenting
* **Views** - Create combinations of filters, highlights and card content and save them in a customer view

**Scenario-only tools:**

* **Activity Log** - Review and download an audit log of all changes made in a scenario since creation
* **Share** - Add collaborators into the scenario
* **Export** - Scenario data, Comparison CSV (before & after), PPT, Orgchart image
* **Comments** - Discussion takes place within that scenario

## Non-Toolbar Tools

**Available in Home Page**

* **Compare** - Side-by-side comparison with other scenarios
* **Approvals** - Submit through approval workflow
* **Share** - Add collaborators within scenario

**Available in Scenario**

* **OpEx Panel -** All modifications with cost/headcount impact; keep open while working
* **Timeline** - Changes by effective date for phased planning

## Org Chart Navigation

* **Pan:** Click and drag the background
* **Zoom:** Scroll wheel or pinch gesture
* **Fit to screen:** Click the fit icon in the corner
* **Expand/collapse:** Click arrow icons on manager cards
* **Find a person:** Press search and type their name

## Related Articles

* [Making Position Changes](/scenarios/using-scenarios-basics/making-position-changes)
* [Scenario Directory](/scenarios/directory)
* [Scenario Forecast](/scenarios/scenario-forecast)


# Creating Scenarios

How to create new scenarios

## How to Create a Scenario

From the homepage, click **+** or **Create Scenario**. Also accessible via the top-right button in Main Org.

### Step 1: Choose a Scenario Type

**Partial Org** *(recommended)* - Scoped to a specific manager's org or a filtered subset. Faster performance, easier to navigate. Best for department reorgs, focused planning, and most day-to-day use.

* **Select by Manager** - Pick a manager; their full reporting hierarchy is included
* **Filter Selection** - Apply Department/Location filters and preview included positions before confirming
* **Tip:** Enable "Manager Filtering" to include the reporting chain above your selection for added context

**Full Org** - Your entire accessible org chart. Use for company-wide reorgs and cross-functional planning. Note: performance may be slower with large orgs (5,000+ employees).

**New Org (blank)** - An empty canvas to build from scratch. Use for new department creation, greenfield design, or zero-based planning.

### Step 2: Name It

Use the pattern: **\[Area] \[Purpose] \[Time Period]**

(Best Practice) ✅ "Engineering Q2 2026 Reorg" · "Commercial NA Budget Cut 10%" · "Product Team Q3 Growth - Option A"

(Not recommended) ❌ "New Scenario" · "Test" · "Draft" · "Scenario 1"

### Step 3: Optional Settings

* **Budget** - Set a cost target (e.g., -$2M). The OpEx Panel tracks green/yellow/red progress as you work.
* **Effective Date** - Target implementation date. Used by Forecast to show when changes take effect.
* **Description** - Document the purpose, problem being solved, key constraints, and expected outcomes.

## After Creating

You'll land directly in the scenario org chart. Before you start, verify:

* Scenario name appears in the top-left corner (not Main Org)
* The correct positions and scope are included
* The summary bar shows the expected headcount and cost

Ready to start? [Making Position Changes](/scenarios/using-scenarios-basics/making-position-changes)

## Troubleshooting

| Problem                              | Solution                                                                                                                  |
| ------------------------------------ | ------------------------------------------------------------------------------------------------------------------------- |
| Scenario creation is taking too long | Switch to Partial Org instead of Full Org                                                                                 |
| Missing positions                    | Confirm the missing positions are present in the Main Org. Widen the filter or select a higher-level manager as the scope |
| Unwanted positions included          | Narrow the filter or select a more specific manager                                                                       |
| Created the wrong type               | Delete and recreate - type can't be changed after creation                                                                |

## Related Articles

* [Making Position Changes](/scenarios/using-scenarios-basics/making-position-changes)
* [Scenario Comparisons](/scenarios/comparisons)
* [Organizing Scenarios](/scenarios/management/organizing-scenarios)


# Using Scenarios

Core scenario actions and workflows

Once you've created a scenario, this section covers the core actions for modeling organizational changes.

## In This Section

* [Making Position Changes](/scenarios/using-scenarios-basics/making-position-changes) - Add, edit, move, close, and duplicate positions
* [Bulk Operations](/scenarios/using-scenarios-basics/bulk-operations) - Select multiple positions and apply changes in batch
* [Working with People](/scenarios/using-scenarios-basics/working-with-people) - Assign, detach, and move employees between positions


# Making Position Changes

Add, edit, move, and remove positions

All position editing happens in Scenarios - Main Org is view-only. Hover over any position card to reveal action buttons.

## Basic Actions

#### Add a Direct Report

1. Hover over a manager card and click **+**

<figure><img src="https://2094208261-files.gitbook.io/~/files/v0/b/gitbook-x-prod.appspot.com/o/spaces%2FCZc46qaaBbVmMuYXPfgz%2Fuploads%2FqGL77lNZsgGZPWOhwKTd%2FScreenshot%202026-03-04%20at%2011.13.47%E2%80%AFAM.png?alt=media&amp;token=154d851b-1087-4c4a-8a9b-47deccb12cf4" alt=""><figcaption></figcaption></figure>

2. A new blank position appears below. Click **Edit** to fill in details (title, department, salary, location, etc.)

<figure><img src="https://2094208261-files.gitbook.io/~/files/v0/b/gitbook-x-prod.appspot.com/o/spaces%2FCZc46qaaBbVmMuYXPfgz%2Fuploads%2FDWFWqUY4lmDGy19t5Hxf%2FScreenshot%202026-03-04%20at%2011.16.41%E2%80%AFAM.png?alt=media&amp;token=5918a64f-d1a9-430f-ae8e-5cb50343ab20" alt=""><figcaption></figcaption></figure>

<figure><img src="https://2094208261-files.gitbook.io/~/files/v0/b/gitbook-x-prod.appspot.com/o/spaces%2FCZc46qaaBbVmMuYXPfgz%2Fuploads%2Fi3TDrKlQYFhjNPLn6TTO%2FScreenshot%202026-03-06%20at%2011.14.57%E2%80%AFAM.png?alt=media&amp;token=14ef234c-e3af-4834-bc28-9c789e4c9988" alt=""><figcaption></figcaption></figure>

New positions are marked with a green indicator in the bottom-left corner.

#### Edit a Position

* Hover > click **Edit** (✏️) > modify fields in the right panel > **Save**
* **Editable:** title, department, manager, salary, pay grade, location, custom fields
* **Not editable:** employee name (use Assign/Detach), employee ID, calculated fields (SOC, layer)

#### Move a position (drag-and-drop)

* Click and hold a card, drag to the new manager, and release
* To move an entire team, drag the manager card — all direct reports move with it
* **Alternative:** Hover > **⋮** > **Change Manager** > select from dropdown (better when the target is far away in the chart)

#### Close a Position

* Hover > click **❌** > select a reason (Layoff/RIF or Exit/Voluntary) > **Confirm**
* Closed positions stay visible (grayed out) and are tracked in the OpEx Panel as cost savings
* Always use **Close** instead of Delete when modeling real reductions - it preserves the audit trail

<figure><img src="https://2094208261-files.gitbook.io/~/files/v0/b/gitbook-x-prod.appspot.com/o/spaces%2FCZc46qaaBbVmMuYXPfgz%2Fuploads%2FsCMfgvKQoHje0oUDSscH%2FScreenshot%202026-03-04%20at%2011.17.15%E2%80%AFAM.png?alt=media&amp;token=cd994d20-ed22-406a-8942-623815caa74d" alt=""><figcaption></figcaption></figure>

#### Duplicate a Position

* Hover > click **📋** > enter quantity > **Duplicate**

<figure><img src="https://2094208261-files.gitbook.io/~/files/v0/b/gitbook-x-prod.appspot.com/o/spaces%2FCZc46qaaBbVmMuYXPfgz%2Fuploads%2FDpXzw2vmIALfenuyyyu7%2FScreenshot%202026-03-04%20at%2011.46.50%E2%80%AFAM.png?alt=media&amp;token=966b1e98-5be2-4450-8704-7155aa90bb6e" alt=""><figcaption></figcaption></figure>

* All copies share the same attributes - edit each individually to customize

#### Delete a Position

* Hover > **⋮** > **Delete** — permanently removes the position from the scenario with no OpEx Panel record

<figure><img src="https://2094208261-files.gitbook.io/~/files/v0/b/gitbook-x-prod.appspot.com/o/spaces%2FCZc46qaaBbVmMuYXPfgz%2Fuploads%2FMXDIyA9dR2RnKCum9Uh9%2Fimage.png?alt=media&amp;token=c8249e58-28ad-4cd4-8134-a5d276083f4f" alt=""><figcaption></figcaption></figure>

* Use only for test positions or mistakes, not for modeling real reductions

#### Employee Assignment

**Assign an employee to a vacant position**

* Hover > click **📎 Assign** > search and select an employee > **Assign**

<figure><img src="https://2094208261-files.gitbook.io/~/files/v0/b/gitbook-x-prod.appspot.com/o/spaces%2FCZc46qaaBbVmMuYXPfgz%2Fuploads%2F2ODcFH4C7AbK4RiS01wh%2FScreenshot%202026-03-04%20at%2011.49.32%E2%80%AFAM.png?alt=media&amp;token=4f52dcd1-74f6-4d3c-b14b-20a464786461" alt=""><figcaption></figcaption></figure>

**Detach an employee**

* Hover > click **📎 Assign** > **Detach Employee**

<figure><img src="https://2094208261-files.gitbook.io/~/files/v0/b/gitbook-x-prod.appspot.com/o/spaces%2FCZc46qaaBbVmMuYXPfgz%2Fuploads%2FRheC3rTSXp6Wqlw2ha4A%2Fimage.png?alt=media&amp;token=46eb2a05-0241-407c-953b-fd23f0aa9c71" alt=""><figcaption></figcaption></figure>

## Advanced Actions (⋮ Menu)

**Add backfill** - Closes the current position and creates a new replacement with the same details. Use for succession planning or modeling departures.

**Add dotted line** - Creates matrix reporting to a secondary manager. The position keeps its primary (solid line) manager and gains a dotted-line relationship.

**Make root** - Elevates the position to top-level (no manager). Use for modeling separate org units or new subsidiaries.

**Select team** - Selects the manager and all direct reports for bulk actions.

<figure><img src="https://2094208261-files.gitbook.io/~/files/v0/b/gitbook-x-prod.appspot.com/o/spaces%2FCZc46qaaBbVmMuYXPfgz%2Fuploads%2F2CIvMQ0aFB6Ht8fTdauw%2FScreenshot%202026-03-04%20at%2011.57.38%E2%80%AFAM.png?alt=media&amp;token=38633d2a-7009-4022-807f-9b3aa0066cba" alt=""><figcaption></figcaption></figure>

## Selecting Multiple Positions

**Single:** click the card

**Multiple:** Cmd+click (Mac) or Ctrl+click (Windows), hovering over a card and pressing "x" on your keyboard

**Entire team:** Hover over manager > **⋮** > **Select Team**

<figure><img src="https://2094208261-files.gitbook.io/~/files/v0/b/gitbook-x-prod.appspot.com/o/spaces%2FCZc46qaaBbVmMuYXPfgz%2Fuploads%2F6mePoQlQasUKN3jQqarJ%2FScreenshot%202026-03-04%20at%2012.00.32%E2%80%AFPM.png?alt=media&amp;token=27229225-3b03-4402-a514-34defb9a5e69" alt=""><figcaption></figcaption></figure>

Once selected, you can change the manager for all, close multiple positions, or edit attributes in bulk. See [Bulk Operations](/scenarios/using-scenarios-basics/bulk-operations).

## Adding Comments

Hover > **⋮** > **Comment** — add notes, explain decisions or ask questions inline on a specific position.

<figure><img src="https://2094208261-files.gitbook.io/~/files/v0/b/gitbook-x-prod.appspot.com/o/spaces%2FCZc46qaaBbVmMuYXPfgz%2Fuploads%2FIw6aR5XGeSHUf7cNh7Fz%2FScreenshot%202026-03-04%20at%2011.59.14%E2%80%AFAM.png?alt=media&amp;token=d8c307c6-0f33-4927-ab10-416a6bd7bf8c" alt=""><figcaption></figcaption></figure>

## Reordering Cards

Use ← → buttons to move cards left or right within the same manager level. This is cosmetic only — it doesn't change reporting relationships.

## Troubleshooting

| Problem                                   | Solution                                                                                                                                                                                           |
| ----------------------------------------- | -------------------------------------------------------------------------------------------------------------------------------------------------------------------------------------------------- |
| Can't make any changes                    | Confirm you are not in the Main Org. Check if you have permissions to edit certain attributes/fields (contact your admin). Confirm you have a stable internet connection, and refresh the browser. |
| Changes aren't showing up                 | Confirm you have a stable connection to the internet, and refresh the browser.                                                                                                                     |
| Drag-and-drop not working                 | Use **⋮** > **Change Manager** and select from the dropdown instead                                                                                                                                |
| Can't find position to assign employee to | Ensure the position you would like to assign an employee to exists. If it does, please reach out to support for help.                                                                              |

## Related Resources

* [Bulk Operations](/scenarios/using-scenarios-basics/bulk-operations)
* [Working with People](/scenarios/using-scenarios-basics/working-with-people)
* [Scenario Tracking & Analysis](/activity-analysis/activity-analysis)
* [Time-Based Planning](/scenarios/time-based-planning)


# Bulk Operations

Editing multiple positions at once

Make the same change across multiple positions at once instead of editing one by one.

## Selecting Multiple Positions

| Method                     | How                                                                                                     | Best for                                                                |
| -------------------------- | ------------------------------------------------------------------------------------------------------- | ----------------------------------------------------------------------- |
| **Org chart multi-select** | Hold `Cmd` (Mac) or `Ctrl` (Windows) and click cards OR Hover over cards and press "x" on your keyboard | Cherry-picking specific visible positions (up to \~20)                  |
| **Select Team**            | Hover over a manager > ⋮ > Select Team                                                                  | Acting on an entire team                                                |
| **Directory selection**    | Switch to Directory, apply filters, click the header checkbox to select all filtered rows               | Large-scale operations (50+ positions) or cross-departmental selections |

Always review the selection count and list in the bulk edit panel before applying.

## Bulk Actions

Once positions are selected, the bulk edit panel opens on the right:

* **Edit Attributes** - Change department, location, job function, pay grade, or any custom field for all selected positions simultaneously. Note: salary is typically not bulk-editable and requires individual consideration.
* **Change Manager** - Reassign all selected positions to a different manager. Use for consolidating teams or restructuring after a manager departure.
* **Close Positions (Bulk RIF)** - Mark multiple positions as closed (Layoff/RIF or Exit/Voluntary). Tracks cost savings in the OpEx Panel and preserves history. Use Close, not Delete, for real org reductions.
* **Detach Employees** - Remove employees from multiple positions, leaving positions vacant and employees available for reassignment.
* **Move to Bench** - Remove employees from the org chart and place them on the bench. Note: Detach leaves positions vacant; Move to Bench removes employees from the structure entirely.
* **Duplicate** - Create multiple copies of a position. Duplicate first, then bulk edit the copies to customize attributes.

## Common Workflows

**Reorganize a whole team** - Directory > Filter by Manager = "Name" > select all > Change Manager to new lead.

**Model a department budget cut** - Directory > Filter by department + pay grade > select target positions > Close Positions > Layoff (RIF) > verify savings in OpEx Panel.

**Standardize job titles** - Org Chart > `Cmd/Ctrl+click` inconsistently-titled positions > Edit Attributes > Job Title > enter new standard value.

**Scale a team** - Duplicate one position (e.g., 10x "Software Engineer") > select all copies > Edit Attributes to customize specialties or locations.

## Keyboard Shortcuts

| Action                      | Shortcut            |
| --------------------------- | ------------------- |
| Multi-select (org chart)    | `Cmd/Ctrl+click`    |
| Quick-select while hovering | `X`                 |
| Select all (Directory)      | `select all button` |
| Deselect all                | `Esc`               |

## Troubleshooting

| Problem                         | Solution                                                             |
| ------------------------------- | -------------------------------------------------------------------- |
| Can't multi-select in org chart | Hold `Cmd/Ctrl` while clicking, or switch to Directory view          |
| Bulk edit panel won't open      | Select at least 2 positions                                          |
| Some positions didn't change    | Those positions may have field restrictions — check the Activity Log |
| Wrong positions selected        | Use Undo immediately from the Activity Log to revert                 |
| Directory selected too many     | Refine your filters, or manually deselect rows before applying       |

## Related Articles

* [Scenario Directory](/scenarios/directory)
* [Making Position Changes](/scenarios/using-scenarios-basics/making-position-changes)
* [Time-Based Planning](/scenarios/time-based-planning)


# Managing Effective Dates in Scenarios

### Overview

Effective dates determine when changes made within a scenario take effect and are reflected in forecasting and analysis. Users can set effective dates either in bulk or for individual cards.

### Setting Effective Dates

There are two ways to update the effective date:

#### 1. Bulk Edit (Multiple Cards)

1. Navigate to your scenario.
2. Select one or more cards.
3. Open the **right-side panel**.
4. Click **Edit Attribute**.
5. Locate the **Effective Date** field (default is set to today).
6. Choose your desired date (e.g., March 29).

<figure><img src="https://2094208261-files.gitbook.io/~/files/v0/b/gitbook-x-prod.appspot.com/o/spaces%2FCZc46qaaBbVmMuYXPfgz%2Fuploads%2FWwsIj8ScxF0X7wGieitZ%2Fimage.png?alt=media&amp;token=eb18d55e-2241-4ea7-b62e-bfd41a2cb186" alt=""><figcaption></figcaption></figure>

7. Save your changes.

#### 2. Individual Card Edit

1. Open a specific card.
2. In the **edit pane**, locate the **Effective Date** at the top right.
3. Update the date as needed (e.g., March 29).

<figure><img src="https://2094208261-files.gitbook.io/~/files/v0/b/gitbook-x-prod.appspot.com/o/spaces%2FCZc46qaaBbVmMuYXPfgz%2Fuploads%2Fbbutb1OpXy4KzzSeeDOx%2Fimage.png?alt=media&amp;token=7e5e34e8-a708-41d5-a614-7b3ff4ede623" alt=""><figcaption></figcaption></figure>

4. Save your changes.

### How Effective Dates Impact Forecasts

* Changes will **only be reflected on or after the selected effective date**.
* If the effective date is set in the future, updates will not appear in forecasts until that date is reached.

### Viewing Changes in Forecast

To review how effective dates impact your scenario:

1. Click the **menu icon**.
2. Select **Forecast**.
3. If the effective date has passed (or is current), you will:
   * See updated values reflected in the forecast.
   * Be able to **compare before and after changes**.

<figure><img src="https://2094208261-files.gitbook.io/~/files/v0/b/gitbook-x-prod.appspot.com/o/spaces%2FCZc46qaaBbVmMuYXPfgz%2Fuploads%2FditFPqV6jwo0EGaVPCBT%2Fimage.png?alt=media&amp;token=d9249b41-8add-42c5-ace9-44d0d033cb54" alt=""><figcaption></figcaption></figure>

### Analyzing Results

You can analyze the impact of your changes in multiple ways:

* View data across:
  * Monthly
  * Quarterly
  * Yearly perspectives
* Export data as a **CSV file** for further analysis.

<figure><img src="https://2094208261-files.gitbook.io/~/files/v0/b/gitbook-x-prod.appspot.com/o/spaces%2FCZc46qaaBbVmMuYXPfgz%2Fuploads%2FUSBF598uh9VDeRPqEeoh%2Fimage.png?alt=media&amp;token=fac087a5-5fa2-44b6-a6ae-695b76ce2764" alt=""><figcaption></figcaption></figure>

### Key Notes

* The default effective date is **today**.
* Future-dated changes will not appear until the selected date is in effect.
* Both bulk and individual editing options provide flexibility depending on your workflow.


# Working with People

Mapping employees to positions

Positions and employees are separate in Agentnoon. Positions are roles in your org structure; employees are the people filling them. A position can be vacant or filled, and employees can move between positions independently.

## Assign an Employee to a Position

1. Hover over a vacant position > click **Assign** (📎)
2. Search by name or employee ID > select > **Assign**

The employee appears on the card. If they were already in another position, they move automatically - no need to detach first.

**Alternative:** Drag an employee's card onto a target position when both are visible on screen.

## Detach an Employee

Hover over a filled position > **⋮** > **Detach Employee** > **Confirm**.

The position becomes vacant and remains in the org chart. The employee is available to reassign elsewhere.

## Common Scenarios

**Internal transfer** - Find the target position > **Assign** > search for the employee. They automatically move from their current position, which becomes vacant.

**Promotion** - Create the new higher-level position under the correct manager > **Assign** the employee to it > their old position becomes vacant for backfill. Note: make sure you have employee & position level fields separated as only employee level fields get copied over.

**Backfill (departing employee)** - Hover over the departing employee's position > **⋮** > **Add Backfill** — closes the existing position and creates a new vacant one in its place.

**Model new hires** - Add positions, leave them vacant, and set salaries and hire dates. Assign real people later when known. Track cost impact in the OpEx Panel.

**Succession planning** - Create multiple scenarios (e.g., Scenario A for Candidate 1, Scenario B for Candidate 2), each assigning a different person to the leadership role.

## The Bench

The bench is a holding area for employees not assigned to any position. They don't appear in the org chart but are available for assignment.

**Move to bench** - Hover over a filled position > **⋮** > **Move to Bench** — the employee moves to the bench and the position becomes vacant.

**Assign from bench** - Click **Assign** on any vacant position — bench employees appear in search results.

Use the bench during large restructurings to temporarily park employees while you determine their new assignments.

## Employee Data Limits

Most employee data (name, ID, start date, personal info) syncs from your HRIS and is read-only in scenarios. What you can change: which position they're assigned to and position-specific attributes (title, salary, department, manager of the role).

## Troubleshooting

| Problem                                       | Solution                                                                                        |
| --------------------------------------------- | ----------------------------------------------------------------------------------------------- |
| Can't find an employee to assign              | They may already be assigned elsewhere - assign directly and Agentnoon moves them automatically |
| Employee disappeared from org chart           | They may have been detached or moved to the bench - search for them or check the bench          |
| Still appears in old position after assigning | Refresh the page. If it persists, detach manually then reassign                                 |
| Can't edit employee name or start date        | This is read-only - make the change in your HRIS                                                |
| Need to model a not-yet-known future hire     | Leave the position vacant and use Comments to note "Future hire: Q2 2026"                       |

## Related Articles

* [Making Position Changes](/scenarios/using-scenarios-basics/making-position-changes)
* [Time-Based Planning](/scenarios/time-based-planning)
* [Bulk Operations](/scenarios/using-scenarios-basics/bulk-operations)


# Scenario Changes & Impact (OpEx Panel)

Tracking scenario changes and workforce cost impact

### :bulb: Protip - before you finalize

Always switch to "Show Changes" mode to see the delta — don't just work in "Show After."&#x20;

<figure><img src="https://2094208261-files.gitbook.io/~/files/v0/b/gitbook-x-prod.appspot.com/o/spaces%2FCZc46qaaBbVmMuYXPfgz%2Fuploads%2FJcPpfeqJKuk9wempvsWU%2FScreenshot%202026-03-04%20at%203.18.24%E2%80%AFPM.png?alt=media&amp;token=cafe96b0-72f6-486b-bf89-478ca43a86d4" alt=""><figcaption></figcaption></figure>

Catch unintended modifications before submission. Then, validate in multiple views:

* Org Chart — Does the structure look correct visually?
* Directory — Are all attributes consistent?
* Forecast — Is the timing accurate?
* Workforce Hub — Are org metrics healthy?

## Scenario Changes & Impact (OpEx Panel)

The OpEx Panel is the central hub for reviewing all changes made in a scenario and understanding their impact on workforce cost. It's also where you submit scenarios for approval.

## Accessing the OpEx Panel

1. Open any scenario
2. Click the panel toggle in the top-right corner

<figure><img src="https://2094208261-files.gitbook.io/~/files/v0/b/gitbook-x-prod.appspot.com/o/spaces%2FCZc46qaaBbVmMuYXPfgz%2Fuploads%2Ff4AgpHiDczB6Eft8LTJu%2FScreenshot%202026-03-04%20at%203.22.53%E2%80%AFPM.png?alt=media&amp;token=cf8b04cf-3910-4dc7-9251-36d32c61bc14" alt=""><figcaption></figcaption></figure>

3. The panel appears on the right side of the screen

<figure><img src="https://2094208261-files.gitbook.io/~/files/v0/b/gitbook-x-prod.appspot.com/o/spaces%2FCZc46qaaBbVmMuYXPfgz%2Fuploads%2Fll28EdBkd1uBX1aYFDoy%2Fimage.png?alt=media&amp;token=dfb883fc-01e1-4f28-93a5-2e18b0490b16" alt=""><figcaption></figcaption></figure>

## What the OpEx Panel Shows

The panel categorizes all scenario changes into:

* **Additions** — New positions created (new hires, new roles)
* **Reductions** — Positions closed (layoffs, exits, eliminations)
* **Data Changes** — Modified attributes on existing positions (title changes, salary adjustments, department moves)
* **Moves** — Changing reporting structures

For each category, the panel shows cost and headcount impact. Switch between salary and custom formulas to evaluate changes using your preferred financial metric.

## Viewing Position Details

Click any position in the OpEx Panel to see:

* Previous values → new values for each changed field
* Cost impact for that specific change
* Change type and effective date

## Cost Impact Summary

The bottom of the panel shows aggregated totals:

* Net headcount change (+/- positions)
* Net cost impact (+/- workforce cost)
* Individual financial impact per position modification

## Effective Date View

Toggle to the effective date view to see all changes grouped by their effective date. Useful for understanding the phased impact of your scenario over time.

## Submitting for Approval

1. Review all changes and their impact in the panel
2. Click **Configure Submission** at the bottom

<figure><img src="https://2094208261-files.gitbook.io/~/files/v0/b/gitbook-x-prod.appspot.com/o/spaces%2FCZc46qaaBbVmMuYXPfgz%2Fuploads%2FA1O5S2LOIhx9NPYvQzzS%2FScreenshot%202026-03-04%20at%2010.57.53%E2%80%AFAM.png?alt=media&amp;token=a27ca150-2cff-4f1a-af4e-1269a2a7bdd9" alt=""><figcaption></figcaption></figure>

<figure><img src="https://2094208261-files.gitbook.io/~/files/v0/b/gitbook-x-prod.appspot.com/o/spaces%2FCZc46qaaBbVmMuYXPfgz%2Fuploads%2FiCMgEsUE7c01BBZwPZik%2FScreenshot%202026-03-04%20at%2010.59.47%E2%80%AFAM.png?alt=media&amp;token=7a5fa2a7-d74e-441d-be34-2bb32519775c" alt=""><figcaption></figcaption></figure>

3. Review the approver list and bottom-line impact

<figure><img src="https://2094208261-files.gitbook.io/~/files/v0/b/gitbook-x-prod.appspot.com/o/spaces%2FCZc46qaaBbVmMuYXPfgz%2Fuploads%2F5q3YmovVEZ5DUAnxpJ89%2Fimage.png?alt=media&amp;token=5cd6ae6f-6d31-4bc5-a8b3-b470e945c24f" alt=""><figcaption></figcaption></figure>

<figure><img src="https://2094208261-files.gitbook.io/~/files/v0/b/gitbook-x-prod.appspot.com/o/spaces%2FCZc46qaaBbVmMuYXPfgz%2Fuploads%2FCgzdwFf3DfWsX2Xpv2iu%2Fimage.png?alt=media&amp;token=96c5ffde-b042-4acb-9775-8ee0b6e1d085" alt=""><figcaption></figcaption></figure>

<figure><img src="https://2094208261-files.gitbook.io/~/files/v0/b/gitbook-x-prod.appspot.com/o/spaces%2FCZc46qaaBbVmMuYXPfgz%2Fuploads%2FSmI2IxvUpQkF5njmg3yh%2Fimage.png?alt=media&amp;token=db162326-e4af-4349-9858-26d0f450003f" alt=""><figcaption></figcaption></figure>

4. Add a justification for your changes
5. Click **Submit**

See [Scenario Approvals](/scenarios/approvals) for the full approval workflow.

## Downloading Change Data

The OpEx Panel doesn't have a built-in export. To download a record of changes:

* **Activity Log** - Provides a detailed view of field-level changes across scenarios, capturing before/after values, user, and timestamp

**Note (Undo & Redo):** Use "Undo" to quickly revert the action you did - if you click on undo accidentally, you should be able to "Redo" the desired action. You can also use Undo & Redo for bulk edits using 1-click.

<figure><img src="https://2094208261-files.gitbook.io/~/files/v0/b/gitbook-x-prod.appspot.com/o/spaces%2FCZc46qaaBbVmMuYXPfgz%2Fuploads%2FrIR8Y13cjUXnOyAYe4eR%2Fimage.png?alt=media&amp;token=254c7020-61c8-4f9c-b492-be1ba82eef67" alt=""><figcaption></figcaption></figure>

* **Export Data** in the toolbar → select **Comparisons Report** to download a before/after comparison of all positions

## Before-and-After Analysis in Workforce Hub

Open Workforce Hub inside a scenario (module dropdown > **Workforce Hub**) to compare baseline vs. scenario state:

* **Headcount** -  by department, location, or any attribute
* **Cost** - total compensation before and after
* **Span of Control** - average SOC and distribution
* **Layers** - number of management levels before and after

Toggle between Before and After views. Apply filters to drill into specific segments.

<figure><img src="https://2094208261-files.gitbook.io/~/files/v0/b/gitbook-x-prod.appspot.com/o/spaces%2FCZc46qaaBbVmMuYXPfgz%2Fuploads%2FZTXQewR1MvHjwi3BfRef%2FScreenshot%202026-03-04%20at%203.37.59%E2%80%AFPM.png?alt=media&amp;token=f3c4be56-9cd5-41d8-bcbd-eab8b38ec088" alt=""><figcaption></figcaption></figure>


# Scenario Approvals

Streamline multi-level approvals

### Before Submitting for Approval

Before submitting perform the following checks:&#x20;

* The name is clear and descriptive
* The justification explains business rationale and expected outcomes
* All changes reviewed in "Show Changes" mode
* The cost impact and headcount delta match targets
* The effective dates are set correctly
* The key views are exported for documentation

### Submitting a Scenario for Approval

## Scenario Approvals

Approval flows ensure scenario changes go through the necessary review process before implementation. Scenario creators can define a structured approval flow with up to two levels of approvers.

## Approval Levels

There are four approval levels across two tiers:

**Organization-level approvers** (set by admin):

* **Level 1** — Reviewers who check budget implications, org chart hygiene, and job title accuracy
* **Level 2** — Decision-makers with final approval on hires

**Scenario-level approvers** (set by scenario creator):

* **Level 0** — Optional pre-check reviewers who provide input before the standard approval chain begins
* **Level 3** — Optional final reviewers who sign off after Level 2, typically used for executive or cross-functional alignment

Once approvers are added, they receive an email notification with a link to the scenario.

## Setting Up Approvers

**Organization-level:**

1. Go to **Settings** → **Approval Configurations**
2. Search and select one or more users as approvers
3. Note: only admins can set up organization-level approvers

**Scenario-level:**

1. Locate the scenario and click **⋮**
2. Click **Configure Approvals** and select approvers

## Submitting a Scenario for Approval

1. Click **Configure Submission** in the OpEx Panel
2. Click **Submit Scenario** in the bottom-right corner
3. Add a justification for your changes
4. Optionally exclude any additions from the submission
5. Click **Submit**

Once submitted, the scenario is locked and cannot be edited unless rejected by an approver.

## Approving a Scenario

Approvers can review scenario details but cannot edit them.

**To review:**

1. Click on the scenario to open it
2. Click **Approve Roles** to review changes

**Available actions per change:**

* **Approve** — The change is marked approved and moves to the next approver in the workflow. The process continues until all required approvers have approved.
* **Reject** — The scenario is immediately marked as rejected

**Admin actions:**

* Admins can un-submit an entire scenario via **⋮** → **Un-submit**. The scenario moves back to review status, allowing collaborators to make edits.

## Revising a Submission

A scenario can only be edited and resubmitted if:

* It was un-submitted by an approver, or
* It was rejected by an approver

Once fully approved, the scenario is finalized and ready for implementation.


# Scenario Approvals

Review and approve scenario changes before they are finalized.

### Overview

Scenario approvals help teams review proposed org changes in a structured way. You can set approval levels, submit a scenario for review, and track whether it is pending, approved, or rejected.

Agentnoon supports both:

* Global approvers, which are set in the main board settings
* Scenario-specific approvers, which are set on an individual scenario

### Before you begin

Make sure:

* You already have a scenario to submit
* The right people already have Agentnoon accounts
* Global approvers are set in **Settings** if needed
* Scenario-specific approvers are set if needed
* Your scenario includes the changes you want reviewed

### Steps

### Set up global approvers&#x20;

**Note:** that if scenario specific approvers are configured, configuring global approvers is optional.

1. Open the main board.
2. Go to **Settings**.
3. In **Approval Configurations**, choose your:
   * **Level 1 approvers**
   * **Level 2 approvers**
4. If you want submitted scenarios to become read-only, enable **Lock Scenarios on submission (Recommended)**.
5. Click **Save**.

### Set up scenario-specific approvers

**Note:** that if global approvers are configured, configuring scenario-specific is optional.

1. Go to the scenario list.
2. Open the scenario menu.
3. Click **Configure approvers**.
4. Review the global approvers shown for:
   * **Level 1 approvers**
   * **Level 2 approvers**
5. Add scenario-specific approvers if needed:
   * **Level 0 approvers**
   * **Level 3 approvers**
6. Click **Save Changes**.

### Submit a scenario for review

1. Open the scenario.
2. Open **Scenario Impact and Changes**.
3. Click **Configure submission**.
4. Review the approver list.
5. Enter a justification in **Justification**.
6. Click **Submit scenario**.
7. Confirm the submission.

### Review a submitted scenario

When a reviewer opens a submitted scenario, they can review:

* **Cost**
* **Count**
* **Reviews**
* **Justification**
* **Reviewer Status**
* **Timeline**

In the **Reviews** tab, the reviewer can:

* Approve individual position changes
* Reject individual position changes
* Use **Approve all**
* Approve the full scenario
* Reject the full scenario

A reviewer must approve all changed positions before approving the scenario.

**Note:** that a review must be completed in one session. Leaving an approval session midway will not save changes.&#x20;

### Update and resubmit after rejection

If a scenario is rejected:

1. Open the scenario again.
2. Make the requested changes.
3. Return to **Scenario Impact and Changes**.
4. Click **Configure submission**.
5. Update the justification if needed.
6. Submit the scenario again.

### Expected result

After **submission**:

* The scenario moves into the approval flow
* Reviewers at the current level can review it
* The scenario can be locked from editing if locking is enabled

After **approval**:

* The scenario moves to the next level of approval, or is marked at "**Approved**" if fully approved

After **rejection**:

* The scenario returns to the submitted and the scenario is unlocked for editing

### Troubleshooting

| Problem                                                  | Solution                                                                                                                |
| -------------------------------------------------------- | ----------------------------------------------------------------------------------------------------------------------- |
| Cannot submit the scenario                               | Check whether any reviewers are configured. Agentnoon can block submission if no reviewers are assigned.                |
| Reviewer cannot edit the scenario                        | This is expected. Submitted scenarios are reviewed in read-only mode (unless otherwise configured in Settings>General). |
| Reviewer cannot approve the complete scenario            | Make sure all changed positions are approved in the **Reviews** tab first.                                              |
| Scenario became editable again after rejection           | This is expected. Rejected scenarios are unlocked for editing.                                                          |
| Some earlier approvals seem to remain after resubmission | This can happen if the underlying position change did not change.                                                       |

### Notes or limitations

* Global approvers are managed in **Settings**.
* Scenario-specific approvers are managed through **Configure approvers** on the scenario.
* Scenario-specific approvers use **Level 0** and **Level 3**.
* Global approvers use **Level 1** and **Level 2**.
* The approval flow starts at the lowest configured level.
* Submitted scenarios can be locked until an approver rejects them.
* Submission requires a justification.
* A scenario cannot be approved until all changed positions are approved.


# Time-Based Planning

Using effective dates for phased changes

## Time-Based Planning

Use date fields to model organizational changes that occur at specific future points, creating accurate time-phased forecasts.

## Core Date Fields

**Hire Date** - When a new position starts (person joins or vacancy is filled). The position appears in Forecast headcount and cost from this date forward.

**Termination Date** - When a person leaves or a position is eliminated. The position no longer appears in headcount after this date and costs are removed from projections.

**Effective Date** - When a change to an existing position takes effect (transfer, reorg, attribute change). The position appears in its "before" state until the effective date, then in its "after" state from that date forward.

### When to Use Each

| Scenario                                                         | Use              |
| ---------------------------------------------------------------- | ---------------- |
| New hire or filling a vacancy                                    | Hire Date        |
| Layoff, RIF, position elimination                                | Termination Date |
| Internal transfer or reorg (same person, new department/manager) | Effective Date   |
| Phased department move (e.g., Q3 effective)                      | Effective Date   |
| Salary increase effective next year                              | Effective Date   |

**Key distinction:** Effective dates preserve position continuity — the same position just changes attributes. Hire and termination dates show positions being created and eliminated.

## How Effective Dates Work in Forecast

When you change a position's department with an effective date of July 1, 2026:

* **In the org chart** - shows the "after" state (new department)
* **In Forecast before July 1** - position counts in the original department
* **In Forecast from July 1 onward** - position counts in the new department

**Show Changes view:** Before the effective date → 0 change; from the effective date → +1 in new department, -1 in old department.

**Example:**

| Department             | Q1 2026 | Q2 2026 | Q3 2026 | Q4 2026 |
| ---------------------- | ------- | ------- | ------- | ------- |
| Network Operations     | 25      | 25      | 20      | 20      |
| Operations & Logistics | 30      | 30      | 35      | 35      |

This shows 5 positions moved in Q3 2026.

## Phased Reorganizations

Set different effective dates on different positions within the same scenario:

* Teams moving in Q2 → effective date April 1, 2026
* Teams moving in Q3 → effective date July 1, 2026
* Teams moving in Q4 → effective date October 1, 2026

Forecast shows the gradual transition, letting budget owners see exactly when departmental headcount and costs shift.

## New Positions

For positions created in a scenario (no "before" state), effective dates control when the position appears in Forecast. The position only ever appears in its assigned department, starting from the effective date.

## Common Questions

**What if I don't set an effective date?**

The change is treated as immediate — it appears in the "after" state for all Forecast time periods.

**Can I set different effective dates on different positions in the same scenario?**

Yes — this is the standard approach for phased reorgs.

**How far can I forecast?**

Up to 5 years from the current date.

**Do effective dates work for all field types?**

Yes — department, location, manager, title, salary, and any custom fields.

**If I move someone with an effective date, do they appear in their old department in the org chart?**&#x20;

No — the org chart always shows the "after" state. Use **Show Before** to see the original state. Forecast is where you see the time-phased view.

## Related Articles

* [Forecast Overview](/forecast/overview)
* [Creating and Managing Scenarios](/scenarios/creating-scenarios)


# Scenario Comparisons

Side-by-side comparison of scenarios

## Scenario Comparisons

Compare 2 scenarios side-by-side to evaluate cost, headcount, structure, and org health metrics before making a decision.

## Accessing Comparisons

1. From the homepage, select exactly 2 scenarios using the checkboxes
2. Click **Compare** in the bottom-right corner

<figure><img src="https://2094208261-files.gitbook.io/~/files/v0/b/gitbook-x-prod.appspot.com/o/spaces%2FCZc46qaaBbVmMuYXPfgz%2Fuploads%2FQRxkO9GKUcZVnHo17vSU%2FScreenshot%202026-03-04%20at%2010.56.07%E2%80%AFAM.png?alt=media&amp;token=563facc7-7cfd-49c4-838a-dff29bfbbfed" alt=""><figcaption></figcaption></figure>

**Note:** Comparisons only work between 2 scenarios and must be started from the homepage.

## What You Can Compare

* **Cost** - Total compensation per scenario vs. baseline (Main Org). Identifies which option fits budget constraints.
* **Headcount** - Total employees per scenario with additions and reductions breakdown. Shows which scenario grows, maintains, or reduces the team.
* **Span of Control** - SoC distributions per scenario with by the attribute selected
* **Pyramid Chart** - Headcount by management layer as a stacked pyramid. Wide/flat = fewer layers and larger teams; tall/narrow = more layers. Identifies top-heavy or overly flat structures.
* **Key Metrics** - Summary table: average span of control, number of management layers, department sizes, and any other configured metrics.

## Common Workflows

**Evaluating budget cuts** - Create Option A (cut Dept X), Option B (across-the-board cuts), Option C (flatten management). Compare cost (verify \~10% savings), then org chart (evaluate structural disruption), then headcount (see which roles are eliminated). Choose the best balance.

**Choosing a reorganization structure** - Compare "Combine teams under one VP" vs. "Keep teams separate with directors." Check Pyramid Chart for layers, Key Metrics for SOC, Org Chart for visual clarity.

**Presenting alternatives to leadership** - Create two scenarios (e.g., Conservative vs. Aggressive hiring). Export the comparison to present cost and headcount differences side-by-side.

## Troubleshooting

| Problem                                | Solution                                                                            |
| -------------------------------------- | ----------------------------------------------------------------------------------- |
| Can't select more than 2 scenarios     | Comparisons only support 2 scenarios at a time                                      |
| Org charts look identical              | Zoom in or scroll — top-level may look the same while department-level differs      |
| Cost shows no difference               | Scenarios must have different changes — identical scenarios will show no difference |
| Can't export comparison                | Check export permissions with your admin                                            |
| Want to compare a scenario to Main Org | Select Main Org as one of the two options — it appears in the scenario list         |

* [Creating Scenarios](/scenarios/creating-scenarios)
* [Scenario Approvals](/scenarios/approvals)
* [Planning a Reorganization](/reference-guides/overview/planning-reorganization)


# Exporting Scenario Data

Exporting scenario data and visuals

## Exporting Scenario Data

Export scenario data, visuals, and analytics for stakeholder presentations, approval documentation, and analysis.

## Export Formats Available

**Visual:** JPEG (org chart screenshot), PowerPoint (full hierarchical slides), PNG (Workforce Hub charts)

**Data:** CSV, Excel, Change Summary, Forecast projections

## How to Export

All exports follow the same pattern:

1. Open the scenario
2. Switch to the relevant module (Org Chart, Directory, Forecast, or Workforce Hub)
3. Set the view mode (Before / After / Changes)
4. Apply any filters
5. Click **Export** and select a format

**Note:** Exports respect your current view mode, active filters, and access permissions.

<figure><img src="https://2094208261-files.gitbook.io/~/files/v0/b/gitbook-x-prod.appspot.com/o/spaces%2FCZc46qaaBbVmMuYXPfgz%2Fuploads%2FMrpTnRq0smSOj2Cnf4XN%2FScreenshot%202026-03-04%20at%203.49.21%E2%80%AFPM.png?alt=media&amp;token=be7d565b-8f5c-43f7-b3b5-025f7ca23cad" alt=""><figcaption></figcaption></figure>

<figure><img src="https://2094208261-files.gitbook.io/~/files/v0/b/gitbook-x-prod.appspot.com/o/spaces%2FCZc46qaaBbVmMuYXPfgz%2Fuploads%2FTDniWDf7qMYVC9p91oF3%2FScreenshot%202026-03-04%20at%203.49.55%E2%80%AFPM.png?alt=media&amp;token=c1a52493-f555-4c11-97a8-432be86cd392" alt=""><figcaption></figcaption></figure>

<figure><img src="https://2094208261-files.gitbook.io/~/files/v0/b/gitbook-x-prod.appspot.com/o/spaces%2FCZc46qaaBbVmMuYXPfgz%2Fuploads%2FEtmP3xb8WrV2fHUpsiAZ%2FScreenshot%202026-03-04%20at%203.49.44%E2%80%AFPM.png?alt=media&amp;token=709f8f0c-37dd-4f0e-b09d-b1e20bb36500" alt=""><figcaption></figcaption></figure>

<figure><img src="https://2094208261-files.gitbook.io/~/files/v0/b/gitbook-x-prod.appspot.com/o/spaces%2FCZc46qaaBbVmMuYXPfgz%2Fuploads%2FChrfX9DkAf8x3BFtVYy1%2FScreenshot%202026-03-04%20at%203.50.09%E2%80%AFPM.png?alt=media&amp;token=373df331-a97d-4f26-bf41-8d80a442bcda" alt=""><figcaption></figcaption></figure>

## Org Chart Exports

**JPEG** - Screenshot of the current framed view. Good for quick visual updates in email or Slack.

**PowerPoint** - Full org chart as structured slides. Configure:

* Filters (department, location)
* Hierarchy depth (top 3 layers, full org, or custom)
* Layout (Vertical, Horizontal, Compact)
* Slide depth (layers per slide)
* Card content (Titles only or full details)

Best for executive and board presentations. Each manager with direct reports gets their own slide.

**Tip:** Export in "Main org" and "Scenario" orgchart separately to create side-by-side comparison slides.

**Note:** If the report contains a large volume of data, the export may not generate immediately. In such cases, you will see a notification (as shown in the screenshots) indicating that the file is being processed. Once the PowerPoint file is ready, you will receive an email with access to download the exported file.

<figure><img src="https://2094208261-files.gitbook.io/~/files/v0/b/gitbook-x-prod.appspot.com/o/spaces%2FCZc46qaaBbVmMuYXPfgz%2Fuploads%2F5jxJrWLzkxGbLglbgaae%2Fimage.png?alt=media&amp;token=f37799e9-683c-4ce6-910d-ccaee0751d2e" alt=""><figcaption></figcaption></figure>

<figure><img src="https://2094208261-files.gitbook.io/~/files/v0/b/gitbook-x-prod.appspot.com/o/spaces%2FCZc46qaaBbVmMuYXPfgz%2Fuploads%2FA4Wbja2OoBPNKfHhltga%2Fimage.png?alt=media&amp;token=e1c9a4af-f86b-4c6e-b730-e461c29018e5" alt=""><figcaption></figcaption></figure>

## Data Exports

**CSV / Excel (Directory)** - Export position data in CSV. Click on Download CSV from your side panel:

1. Click on Download CSV from your side panel
2. Click the column selector in export to choose which fields to include
3. Select columns to include
4. Apply filters to limit which positions export
5. Click **Download**

**Saved Reports** - After configuring columns and order, click **Save Report** to save the configuration for future use. Access saved reports from the **Download CSV** dropdown.

Note: CSV exports are less commonly used. Most users prefer org chart PowerPoint or change summaries for stakeholder communication.

**Comparison CSV** - Comparison CSV directly form the side panel inside a scenario. Includes every changed position with change type, before/after values, cost impact, and effective date.

**Forecast export** - From Forecast view, configure time period, aggregation, and metric, then export the projection table. Shows headcount and cost by department over time, phased by effective dates.

**Workforce Hub** - Export individual charts as PNG, or create slide packs with multiple charts. See [Hub Packs](/hub/packs) for creating PowerPoint presentations with multiple analytics charts.

## Export by Use Case

**For approval submission** - Comparison CSV (Excel) + Org chart PowerPoint ("Show After") + Forecast cost projection

**For stakeholder communication** - JPEG or filtered PowerPoint + Comparison CSV filtered to the relevant department

**For implementation planning** - Full change list (CSV) + positions sorted by effective date

**For financial analysis** - Forecast export (cost by quarter) + Comparison CSV (cost per change) + Excel of all positions with salaries

## Troubleshooting

| Problem                             | Solution                                                        |
| ----------------------------------- | --------------------------------------------------------------- |
| Export button grayed out            | Verify your role has export access — contact the scenario owner |
| Exported data doesn't match screen  | Check the active view mode (Before/After/Changes) and filters   |
| Effective dates missing from export | Export from Forecast view or use the Comparison CSV export      |

## Related Articles

* [Main Org Exporting](/main-org/exporting)
* [Scenario Comparisons](/scenarios/comparisons)
* [Forecast Reports & Exports](/forecast/overview)


# Scenario Management

Organizing, tagging, and versioning scenarios

As you create more scenarios, keeping them organized becomes essential. This section covers tools for managing your growing library of workforce planning scenarios.

## In This Section

* [Basic Actions](/scenarios/management/basic-actions) — Create, open, rename, duplicate, and delete scenarios
* [Tags](/scenarios/management/tags) — Organize scenarios by department, quarter, or purpose
* [Symbols](/scenarios/management/symbols) — Understand the visual change indicators on position cards
* [Organizing Scenarios](/scenarios/management/organizing-scenarios) — Naming conventions, versioning, and keeping a clean workspace


# Basic Actions

Renaming, duplicating, archiving, and deleting scenarios

As you create more scenarios, keeping them organized becomes essential. This section covers tools for managing your growing library of workforce planning scenarios. For creating scenarios, see [Creating Scenarios](/scenarios/creating-scenarios).&#x20;

## Rename a Scenario

**From the homepage:** Click on the "Edit" icon > enter new name > **Save**

<figure><img src="https://2094208261-files.gitbook.io/~/files/v0/b/gitbook-x-prod.appspot.com/o/spaces%2FCZc46qaaBbVmMuYXPfgz%2Fuploads%2FZ7x6jvDVPKTu6pkALbXe%2FScreenshot%202026-03-05%20at%2010.49.35%E2%80%AFAM.png?alt=media&amp;token=e19abe02-c3dc-4058-ae18-7978b9d18b91" alt=""><figcaption></figcaption></figure>

**From inside a scenario:** Click the scenario name in the top-left, type the new name, and press **Enter**.

**Tip:** Include purpose, timeframe, and version — e.g., "Engineering Q2 2026 Expansion - Option A"

## Duplicate a Scenario

Use duplication to test alternatives while keeping the original intact.

1. Click on "Duplicate" icon
2. A copy is created with "\[Original Name] Copy"
3. Rename the duplicate to reflect its purpose

The duplicate includes all positions, changes, and effective dates. It does not include shared access or approval status — it starts as a new draft.

## Delete a Scenario

1. Click **⋮** on the scenario
2. Select **Delete**
3. Confirm deletion

<figure><img src="https://2094208261-files.gitbook.io/~/files/v0/b/gitbook-x-prod.appspot.com/o/spaces%2FCZc46qaaBbVmMuYXPfgz%2Fuploads%2F3ivkWuR0pyJppui252gx%2Fimage.png?alt=media&amp;token=8443f557-4d16-456f-8944-a27f1b28df9a" alt=""><figcaption></figcaption></figure>

Deletion is permanent and cannot be undone. Use it only for test scenarios or duplicates you no longer need.

## Switching Between Scenarios

From inside a scenario, click the scenario name dropdown in the top-left to see all accessible scenarios and switch between them. Your current scenario autosaves.

:bulb: **Protip - Backup Before Major Operations** - Duplicate your scenario before: a scenario refresh, merging, large bulk operations, or wide sharing. In the scenario actions menu (⋮) > Duplicate Scenario. Name the backup with a date (e.g., "Plan - BACKUP 2026-02-18").


# Tags

Organizing scenarios with tags and filters

Tags help you organize and filter scenarios by department, quarter, project, or status.

### Adding Tags to Scenarios

1. Click **⋮** on any scenario

<figure><img src="https://2094208261-files.gitbook.io/~/files/v0/b/gitbook-x-prod.appspot.com/o/spaces%2FCZc46qaaBbVmMuYXPfgz%2Fuploads%2F4xhoNuVncBFFKRZ7AWZo%2FScreenshot%202026-03-05%20at%201.22.55%E2%80%AFPM.png?alt=media&amp;token=bf6f4c25-880c-43bd-b535-0e862bf6f198" alt=""><figcaption></figcaption></figure>

2. Select **Change Tag**
3. Choose an existing tag from the dropdown or type a new tag name

<figure><img src="https://2094208261-files.gitbook.io/~/files/v0/b/gitbook-x-prod.appspot.com/o/spaces%2FCZc46qaaBbVmMuYXPfgz%2Fuploads%2Fmb0uBk8d2u6qX2DKlRGY%2Fimage.png?alt=media&amp;token=30339a2a-7972-4124-8177-07c42c6c22ad" alt=""><figcaption></figcaption></figure>

4. Press **Enter**

The tag appears as a label on the scenario card.

### Common Tag Examples

**By Department** — Engineering, Sales, Marketing, Product, Operations, Finance

**By Planning Cycle** — Q1 2026, Q2 2026, H1 2026, FY27

**By Purpose** — Budget Cuts, Growth Plans, Reorgs, Hiring, Succession

**By Status** — Draft, In Review, Approved, Implemented

**By Project** — AI Initiative, Expansion EMEA, GTM Realignment

**Tip:** Use consistent naming conventions across your organization (e.g., always "Q1 2026" not "q1-2026").

## Multiple Tags

Some organizations support multiple tags per scenario (e.g., "Engineering" + "Q2 2026" + "Hiring"). Check with your admin to see if this is enabled. If only single tags are supported, use compound tags like "Engineering - Q2 2026".Tags

Tags help you organize and filter scenarios by department, quarter, project, or status.

## Best Practices

* **Be consistent** — Agree on tag naming conventions with your team
* **Clean up regularly** — Archive or delete tags for old quarters and completed projects
* **Combine with scenario names** — Tags complement clear scenario naming, they don't replace it


# Symbols

Spot scenario changes with visual symbols

Scenario symbols visually mark the changes you've made to roles or employees — so you can easily track updates, communicate intent, and stay aligned while planning.

## RIF/Closed/Exit <img src="https://2094208261-files.gitbook.io/~/files/v0/b/gitbook-x-prod.appspot.com/o/spaces%2FCZc46qaaBbVmMuYXPfgz%2Fuploads%2FRjnVXj4EL2xclHe3Jbk2%2Fimage.png?alt=media&amp;token=bef13771-1154-410e-922a-03f3c8095eb3" alt="" data-size="line">

Indicates a role marked for reduction in force (RIF) or layoff or has been filled and closed or represents an employee who has resigned or is leaving the organization voluntarily.

## Edit <img src="https://2094208261-files.gitbook.io/~/files/v0/b/gitbook-x-prod.appspot.com/o/spaces%2FCZc46qaaBbVmMuYXPfgz%2Fuploads%2FlRfsTxfMezt6bJwiVSfY%2Fimage.png?alt=media&amp;token=1b5d38e8-10e7-4d06-ac54-ad13c3e88cd8" alt="" data-size="line">

Marks any edits made to an employee or position's data — title, salary, or department.

## Newly Added Positions <img src="https://2094208261-files.gitbook.io/~/files/v0/b/gitbook-x-prod.appspot.com/o/spaces%2FCZc46qaaBbVmMuYXPfgz%2Fuploads%2FyyvAyU5hEEUYHKKfEDUv%2Fimage.png?alt=media&amp;token=4e511375-45f6-4b94-b4bc-fec18b6ea2f3" alt="" data-size="line">

Indicates a role or employee added as part of the scenario.

## Move <img src="https://2094208261-files.gitbook.io/~/files/v0/b/gitbook-x-prod.appspot.com/o/spaces%2FCZc46qaaBbVmMuYXPfgz%2Fuploads%2FhnYY38H1GqCVNYV7VTZb%2Fimage.png?alt=media&amp;token=478742cc-d179-4428-bcc7-9fce3099618e" alt="" data-size="line">

Represents a position moved to a different manager or department in the org chart.

## Bench

Flags positions you're still evaluating or want to revisit. No immediate decision is tied to it.

## Detach from Position

Indicates an employee has been unassigned, leaving the position vacant but intact for future reassignment.

Scenario symbols visually mark the changes you’ve made to roles or employees - like new additions, exits, or edits - so you can easily track updates, communicate intent, and stay aligned while planning.


# Organizing Scenarios

Best practices for naming, versioning, and organizing scenarios

Keep your scenario library navigable as it grows.

## Naming Convention

Use the format: **\[Purpose] - \[Scope] - \[Version/Date]**

Examples:

* "Engineering Reorg - Flatten Structure - v2"
* "Q2 Hiring Plan - Commercial NA - 2026-02-15"
* "Budget Cut 10% - Option A"
* "VP Engineering Succession - Candidate A"

**Purpose (required)** — What the scenario does: "Hiring Plan", "Budget Cut", "Reorganization", "Succession"

**Scope (recommended)** — Which team, department, or geography is affected

**Version or date (situational)** — Use v1/v2/v3 for iterations, Option A/B/C for alternatives, or a date for chronological tracking

Never leave a scenario named "Untitled Scenario" or "New Scenario."

## Versioning

Create a new version when stakeholder feedback requires significant revisions, you're testing a completely different approach, or you want to preserve the previous version for reference. For minor corrections (typos, small salary tweaks), just update the existing scenario.

**Version naming options:**

* Numbered: "Plan v1", "Plan v2"
* Lettered: "Plan - Option A", "Plan - Option B"
* Descriptive: "Plan - Conservative", "Plan - Aggressive"
* Date-based: "Plan - Feb 15"
* Combined: "Plan v2 - Aggressive - Feb 15"

## Delete

**Delete when** - it was a test or mistake with no meaningful content.

**Cleanup cadence:**

* **Weekly (5 min)** — Rename any "Untitled" scenarios; delete obvious test scenarios
* **Monthly (30 min)** — Standardize names; export change logs before archiving

## Comparison Sets

When evaluating multiple approaches, create a named set:

1. Create a base scenario: "Reorg - Base Analysis"
2. Duplicate and name each option: "Reorg - Option A - Flatten", "Reorg - Option B - Add Layer", "Reorg - Option C - Hybrid"
3. Tag all with a shared label (e.g., "Q2 Reorg Comparison")
4. Use Scenario Comparisons to evaluate side-by-side

## Ownership

Assign a clear owner to each scenario — they're responsible for naming, cleanup, and archiving. For shared scenarios, designate one "scenario lead" to coordinate edits and maintain consistency.

## Related Resources

* [Tags](/scenarios/management/tags)
* [Basic Actions](/scenarios/management/basic-actions)
* [Scenario Management Overview](/scenarios/management)


# Scenario Collaboration

Working with teammates on scenarios

Scenarios are built for teamwork. Agentnoon provides collaboration features including sharing, commenting, and presence indicators to help teams plan together.

## In This Section

* [Sharing Scenarios](/scenarios/collaboration/sharing-scenarios) — Control who can edit your scenarios
* [Commenting](/scenarios/collaboration/commenting) — Discuss plans with scenario-level comments
* [Working with Others](/scenarios/collaboration/co-editing) — Presence indicators and coordinating with teammates
* [Notifications](/admin-capabilities/notifications) — Stay updated on approvals, invitations, and account activity


# Sharing Scenarios

Share scenarios with team members and control access levels

Share scenarios to collaborate with teammates, collect stakeholder feedback, and present plans to leadership.

## **How to share:**

1. Open the scenario
2. Click **Share** in the left panel or top toolbar

<figure><img src="https://2094208261-files.gitbook.io/~/files/v0/b/gitbook-x-prod.appspot.com/o/spaces%2FCZc46qaaBbVmMuYXPfgz%2Fuploads%2F11jJyAaCCAV4qPewC7PU%2FScreenshot%202026-03-05%20at%2010.49.35%E2%80%AFAM.png?alt=media&amp;token=2def02e6-5fb6-4377-8010-dde8f1f3251d" alt=""><figcaption></figcaption></figure>

<figure><img src="https://2094208261-files.gitbook.io/~/files/v0/b/gitbook-x-prod.appspot.com/o/spaces%2FCZc46qaaBbVmMuYXPfgz%2Fuploads%2FHNzcGW9sP0Ve43UkW2SU%2FScreenshot%202026-03-05%20at%201.34.55%E2%80%AFPM.png?alt=media&amp;token=0e7a1c1d-e736-4d7e-95b9-5d55391558d9" alt=""><figcaption></figcaption></figure>

3. Enter email addresses or select users from the list

<figure><img src="https://2094208261-files.gitbook.io/~/files/v0/b/gitbook-x-prod.appspot.com/o/spaces%2FCZc46qaaBbVmMuYXPfgz%2Fuploads%2FBRm5FV5zhebKSOWXnigd%2Fimage.png?alt=media&amp;token=9a619119-8f27-49aa-b22d-cce90839d543" alt=""><figcaption></figcaption></figure>

4. Click **Share**

Users receive an email notification and can access the scenario from their homepage.

## Scenario Access

Can: edit everything in their scope if they have edit access in Agentnoon.

Cannot: delete the scenario, change the scenario owner.

Use for: co-planners who need to build out the scenario.

## Permissions and Scope

Scenario sharing **respects existing user permissions**. If a user only has access to the Engineering department, they'll only see Engineering positions — even in a Full Org scenario. Scenario sharing does not override org-level access controls.

## Troubleshooting

| Problem                                     | Solution                                                                              |
| ------------------------------------------- | ------------------------------------------------------------------------------------- |
| User can't see positions in shared scenario | Check their org-level permissions — they may only have access to specific departments |
| User can't edit despite Edit Access         | Verify access level from admins; confirm they have edit access in the org             |
| Can't remove user's access                  | Only the scenario owner can manage access; ask the owner or an admin                  |
| User didn't receive share notification      | Check email address is correct; check spam folder; verify notification settings       |

## Next Steps

* Learn [Commenting](/scenarios/collaboration/commenting) to discuss scenarios with teammates
* Understand [Notifications](/admin-capabilities/notifications) to stay updated on approvals
* Return to [Scenario Collaboration](/scenarios/collaboration) overview


# Commenting

Add comments and discussions to scenarios

Comments let you discuss scenarios with teammates — ask questions, provide feedback, document decisions, and tag collaborators (@mention), all within your planning work.&#x20;

## How to Add a Comment

1. Open the scenario
2. Click the **Comments** icon in the left panel
3. Type your comment
4. Click **Post**

<figure><img src="https://2094208261-files.gitbook.io/~/files/v0/b/gitbook-x-prod.appspot.com/o/spaces%2FCZc46qaaBbVmMuYXPfgz%2Fuploads%2FD7TZfVjxLPYwpFQ6BX5z%2FScreenshot%202026-03-05%20at%201.36.54%E2%80%AFPM.png?alt=media&amp;token=a3fc9f37-b57a-4f25-a47a-7699762417c3" alt=""><figcaption></figcaption></figure>

**When to use:**

* General questions about the scenario
* High-level feedback and suggestions
* Summarizing changes you made
* Requesting review from stakeholders

## Viewing and Managing Comments

**View all comments** — Click the **Comments** icon in the left panel to see all comments, sorted by most recent.

**Delete comments** — Open a comment > click **⋮** > **Delete**. Only comment authors and scenario owners can delete comments.

## Common Commenting Workflows

#### Documenting Decisions

&#x20;Add a comment after each major change to document your reasoning, for example:

* "Closed this role due to budget constraints — $120K savings"
* "Added 5 new SDE roles to support the AI initiative roadmap"

When the scenario is approved, comments serve as the historical record.

#### Collecting Feedback

1. Share the scenario with stakeholders (View Only or Comment Only access)
2. Add a comment explaining what you need: "Please review and leave comments by Friday"
3. Stakeholders add their own comments
4. Resolve comments as you address each piece of feedback

#### Coordinating Between Planners

If two planners are working on the same scenario:

1. Planner A adds a comment: "Working on Engineering section now"
2. Planner B sees the comment and adds: "Got it, I'll handle Sales"
3. Both resolve comments as work progresses

## Best Practices

* **Comment liberally** — Explain your reasoning for key decisions
* **Be specific** — "Should this role report to the Engineering VP?" is better than "Thoughts?"
* **Resolve when done** — Keep the comment list focused on active discussions

## Troubleshooting

| Problem              | Solution                                                            |
| -------------------- | ------------------------------------------------------------------- |
| Comments not showing | Refresh the page; check if you're filtering to show only unresolved |

## Next Steps

* Learn [Notifications](/admin-capabilities/notifications) to stay updated on approvals and invitations
* Explore [Sharing Scenarios](/scenarios/collaboration/sharing-scenarios) to control who can comment
* Return to [Scenario Collaboration](/scenarios/collaboration) overview


# Working with Others

Working in scenarios with other users

Multiple users can have a scenario open at the same time. Agentnoon shows who else is present and lets you coordinate via comments. Give edit access only to active collaborators and use view-only for stakeholders who just need visibility.

## Real-Time Presence

When other users have the same scenario open, their **profile icons** appear at the top of the scenario. Hover over an icon to see the user's name.

<figure><img src="https://2094208261-files.gitbook.io/~/files/v0/b/gitbook-x-prod.appspot.com/o/spaces%2FCZc46qaaBbVmMuYXPfgz%2Fuploads%2FyOiH41Zl4Lfq7iqCl5Vt%2FScreenshot%202026-03-05%20at%201.39.08%E2%80%AFPM.png?alt=media&amp;token=7f2bf49f-c8b7-4bb7-83cc-9955072e9383" alt=""><figcaption></figcaption></figure>

Use presence indicators to:

* Know when a colleague is actively reviewing your work
* Coordinate who is working on which section before making changes
* Avoid editing the same positions simultaneously

## Coordinating with Collaborators

Since multiple users can edit a scenario with Edit Access, coordinate to avoid conflicts:

1. Add a comment announcing which section you're working on (e.g., "Working on Engineering — taking until EOD")
2. Check the presence icons before making large structural changes
3. Work in different departments or branches to minimize overlap
4. If two users edit the same position simultaneously, the last save wins — use OpEx Panel to review what happened

## Best Practices

* **Communicate first** — Use comments to announce your focus area before making changes
* **Divide by section** — Work in different departments or functions
* **Review together** — Walk through the final scenario as a team before submitting for approval
* **Limit concurrent editors** — 2–3 people editing at once is manageable; more can cause confusion

:bulb:**Protip —** Use Comments to explain changes and document assumptions. This is especially important for changes that might need justification during approval.

Give edit access only to active collaborators; use view-only for stakeholders who just need visibility

## Related Articles

* [Sharing Scenarios](/scenarios/collaboration/sharing-scenarios) — Control who has Edit access
* [Commenting](/scenarios/collaboration/commenting) — Coordinate via comments
* [Notifications](/admin-capabilities/notifications) — Stay informed of approvals and invitations


# Scenario Directory

Table view in scenarios with change highlighting

The Scenario Directory is a spreadsheet-style table of all positions with change highlighting, bulk selection, and export. Unlike the Main Org Directory (view-only), Scenario Directory lets you select, bulk edit, and export changed data.

**How to Access:** Click the Directory icon in the toolbar, select it from the Org Chart dropdown, or press `2`.

<figure><img src="https://2094208261-files.gitbook.io/~/files/v0/b/gitbook-x-prod.appspot.com/o/spaces%2FCZc46qaaBbVmMuYXPfgz%2Fuploads%2F7oLZYZ8ICgvvZgfEDWj8%2Fimage.png?alt=media&amp;token=bf0187dd-7554-468d-80f8-85333524c0e0" alt=""><figcaption></figcaption></figure>

## Filtering for Changes

Use filters to focus on specific change types:

* **Change Type = Addition** — Review all new positions before submitting
* **Change Type = Reduction** — Audit all RIFs
* **Change Type = Modification** — See what was edited and at what cost

**Common combinations:**

`Department = "Engineering" AND Change Type = "Addition"` (all new Engineering hires); `Change Type ≠ "No Change"` (all changes only, for export to Finance).

## Bulk Selection and Editing

Scenario Directory supports mass selection for bulk actions:

* **Click checkbox** to select individual rows
* **Click header checkbox** to select all visible (filtered) rows
* **Shift+click** to select a range

Once selected, the bulk edit panel opens. Available actions: Edit Attributes, Change Manager, Close Positions, Detach Employees, Move to Bench, Export Selection.

**Learn more:** [Bulk Operations](/scenarios/using-scenarios-basics/bulk-operations)

## Exporting from Directory

1. Set filters and visible columns as desired
2. Click **Export** > choose file (CSV, Comparison CSV) and scope (all/selected fields)
3. Export includes all visible columns: change indicators, before/after values, cost impact, effective dates

## Troubleshooting

| Problem                        | Solution                                                                                                                |
| ------------------------------ | ----------------------------------------------------------------------------------------------------------------------- |
| Scenario status column missing | Click column settings > check "Scenario status"                                                                         |
| Bulk selection not working     | Confirm you're in a Scenario (Main Org Directory is view-only)                                                          |
| Color-coding not showing       | Refresh the page                                                                                                        |
| Can't edit in Directory        | Confirm that you are in a scenario. Select positions > use bulk edit panel, or click a position to open the edit panel. |

## Related Articles

* [Bulk Operations](/scenarios/using-scenarios-basics/bulk-operations)
* [Scenario Exporting](/scenarios/exporting)


# Scenario Forecast

Viewing forecast projections within scenarios

Scenario Forecast shows time-phased projections of your planned changes — when they take effect, headcount and cost over time, and before/after comparisons.

## Accessing

Open any scenario > click the view dropdown > select **Forecast**.

<figure><img src="https://2094208261-files.gitbook.io/~/files/v0/b/gitbook-x-prod.appspot.com/o/spaces%2FCZc46qaaBbVmMuYXPfgz%2Fuploads%2FyEKTinHrmRjDOaXxoGKk%2Fimage.png?alt=media&amp;token=c410f285-b638-4d42-9630-9ed017b2944e" alt=""><figcaption></figcaption></figure>

## Configuration

* **Row aggregator** — Department, Location, Country, Employee Type, Manager, Job Title, or any custom field
* **Metric** — Headcount (count of positions) or Cost (monetary projection)
* **Monetary fields (cost view)** — Select which compensation components to include: Salary, Bonuses, Allowances, Stock, Benefits, custom fields
* **Time period** — Monthly (detailed hiring plans), Quarterly (most common for planning and reporting), Yearly (multi-year strategy, shows up to 5 years)

**Before / After / Changes toggle:**

* **Show Before** — Main Org baseline extended over time

<figure><img src="https://2094208261-files.gitbook.io/~/files/v0/b/gitbook-x-prod.appspot.com/o/spaces%2FCZc46qaaBbVmMuYXPfgz%2Fuploads%2FA98QTUVSDKhxohtam7LC%2FScreenshot%202026-03-05%20at%201.42.58%E2%80%AFPM.png?alt=media&amp;token=a1609ca6-b6d3-4295-87cc-8b59e694f68e" alt=""><figcaption></figcaption></figure>

* **Show After** — All scenario changes applied; view full proposed state

<figure><img src="https://2094208261-files.gitbook.io/~/files/v0/b/gitbook-x-prod.appspot.com/o/spaces%2FCZc46qaaBbVmMuYXPfgz%2Fuploads%2FBtRP3VEuDb7v3QToqSPS%2FScreenshot%202026-03-05%20at%201.43.18%E2%80%AFPM.png?alt=media&amp;token=1caf3262-446e-4de9-a7ea-e475ea5ff5c6" alt=""><figcaption></figcaption></figure>

* **Show Changes** — Delta only (+ and −); most useful for communicating impact

<figure><img src="https://2094208261-files.gitbook.io/~/files/v0/b/gitbook-x-prod.appspot.com/o/spaces%2FCZc46qaaBbVmMuYXPfgz%2Fuploads%2FXAD1h2XTW84B1HiaQ0ZS%2FScreenshot%202026-03-05%20at%201.43.41%E2%80%AFPM.png?alt=media&amp;token=1d0cd05b-4937-4805-9373-9102dfd19777" alt=""><figcaption></figcaption></figure>

## How Effective Dates Work in Forecast

When you change a position's department with an effective date of July 1, 2026:

* **Through Q2** — the position appears in its original department
* **From Q3 onward** — the position appears in its new department

Without an effective date, changes are treated as immediate — the position appears in the new state for all time periods.

**Example (Show After, Quarterly):**

| Department      | Q1 | Q2 | Q3 | Q4 |
| --------------- | -- | -- | -- | -- |
| Network Ops     | 25 | 25 | 20 | 20 |
| Ops & Logistics | 30 | 30 | 35 | 35 |

5 positions moved in Q3.

## Common Use Cases

**Phased hiring plan** — Add positions with hire dates across Q1–Q4 > Monthly/Quarterly > Headcount > Show Changes → see exactly when each hire hits headcount and cost.

**Phased reorg** — Assign different effective dates to different teams > Quarterly > Show Changes → see the gradual transition by department.

**Budget impact** — Make changes (promotions, hires, closures) > Cost view > Salary + Bonus > Show Changes → quarterly cost delta per department.

**Scenario comparison** — View Scenario A in Forecast (note projections) > open Scenario B > compare timing and magnitude.

## FAQ

**Can different positions in the same scenario have different effective dates?** Yes — each position can have its own effective date

**What's the difference between Hire dates vs. effective dates?**

Use hire dates for new positions being filled; use effective dates for changes to existing positions (reorganizations, transfers, attribute changes).

## Related Articles

* [Time-Based Planning](/scenarios/time-based-planning)
* [Forecast Overview](/forecast/overview)
* [Forecast Navigation](/forecast/navigation)


# Scenario Workforce Hub

Using Workforce Hub analytics within scenarios

The Scenario Workforce Hub provides analytics to help you validate your scenario changes with data. Use it to analyze span of control, headcount distribution, and org structure before and after your proposed changes.

<figure><img src="https://2094208261-files.gitbook.io/~/files/v0/b/gitbook-x-prod.appspot.com/o/spaces%2FCZc46qaaBbVmMuYXPfgz%2Fuploads%2FEEGvCOVTk0ZPC8ak6TXc%2Fimage.png?alt=media&amp;token=ac043d6c-3c0c-40a3-8b41-c430489662bd" alt=""><figcaption></figcaption></figure>

## Accessing Scenario Workforce Hub

1. Open any scenario
2. Click the **view dropdown** at the top (default shows "Org chart")
3. Select **"Workforce Hub"**

The Hub automatically reflects your scenario's current state.

<figure><img src="https://2094208261-files.gitbook.io/~/files/v0/b/gitbook-x-prod.appspot.com/o/spaces%2FCZc46qaaBbVmMuYXPfgz%2Fuploads%2F2Vc3xeSEeJ3gXZUYNYOU%2Fimage.png?alt=media&amp;token=f313e763-bb4a-439d-9cb4-ac043f6d143e" alt=""><figcaption></figcaption></figure>

## Before / After / Changes Toggle

Use the toggle at the top of the scenario to switch Hub analytics between:

* **Show Before** — Baseline metrics from Main Org (current state)
* **Show After** — Metrics with all scenario changes applied (proposed state)
* **Show Changes** — Delta between Before and After (what is improving or worsening)

<figure><img src="https://2094208261-files.gitbook.io/~/files/v0/b/gitbook-x-prod.appspot.com/o/spaces%2FCZc46qaaBbVmMuYXPfgz%2Fuploads%2FprVYLrBG6WpZerT5CfXx%2FScreenshot%202026-03-05%20at%201.46.42%E2%80%AFPM.png?alt=media&amp;token=0cf5b1eb-7c6d-4d38-ab68-39ec972a7d2a" alt=""><figcaption></figcaption></figure>

**Tip:** "Show Changes" is the most powerful view for communicating impact to stakeholders — it clearly shows what is improving vs. degrading.

## Common Use Cases

**Validate a reorganization** — Switch to Layers & Spans > toggle **Show Before** then **Show After** > identify managers with extreme spans > adjust in the org chart > revalidate.

**Check departmental balance** — Switch to Headcount Distribution > select Department > toggle **Show Changes** > confirm changes align with goals.

**Identify succession gaps** — Switch to Headcount Heatmap > set X = Job Level, Y = Department > toggle **Show After** > look for departments missing senior roles.

## Exporting Hub Charts

1. Configure the chart to the view you want (Before/After/Changes)
2. Apply any filters
3. Click the **export/download** button (top-right of chart)
4. Choose PNG (for documents/email) or CSV (for data analysis)

Use exported charts in business cases, planning presentations, and leadership reviews.

## Related Articles

* [Workforce Hub Overview](/hub/overview)
* [Layers & Spans Chart](/hub/layers-spans-chart)
* [Headcount Distribution Chart](/hub/headcount-distribution-chart)
* [Headcount Heatmap Chart](/hub/headcount-heatmap-chart)


# Advanced Scenario Actions

Advanced operations for scenario management

Once you're comfortable with basic scenario operations, these advanced actions unlock powerful workflow capabilities.

## In This Section

* [Scenario Refresh](/scenarios/advanced-actions/scenario-refresh) — Update an existing scenario with the latest Main Org data while preserving your changes
* [Scenario Merging](/scenarios/advanced-actions/merging) — Combine multiple scenarios into a single consolidated plan
* [Scenario to Main Org](/scenarios/advanced-actions/scenario-to-main-org) — Promote an approved scenario to become your new current state
* [Partial Data Upload](/scenarios/advanced-actions/partial-data-upload-1) — Upload data for specific parts of a scenario


# Scenario Merging

Combine changes from multiple scenarios into one

Scenario Merging lets you consolidate changes from one scenario (source) into another (destination). Use it when multiple teams have worked on separate scenarios that need to be combined.

**Best for** — Independent teams working on non-overlapping parts of the org. The less overlap between scenarios, the smoother the merge.

## How to Merge

1. Open the destination scenario
2. Go to Toolbar > **Data Management** > **Merge Scenario**

<figure><img src="https://2094208261-files.gitbook.io/~/files/v0/b/gitbook-x-prod.appspot.com/o/spaces%2FCZc46qaaBbVmMuYXPfgz%2Fuploads%2FSu7GOewm4hbsNgClfXEB%2Fimage.png?alt=media&amp;token=84c96caa-638b-43d9-9749-2f06ced401e5" alt=""><figcaption></figcaption></figure>

3. Select the source scenario from the dropdown

<figure><img src="https://2094208261-files.gitbook.io/~/files/v0/b/gitbook-x-prod.appspot.com/o/spaces%2FCZc46qaaBbVmMuYXPfgz%2Fuploads%2F9QTHKd2tZin8U2kymcvc%2Fimage.png?alt=media&amp;token=d8caf037-ba8b-453c-b8c1-b7f39cf99d0d" alt=""><figcaption></figcaption></figure>

4. **Select Records** — choose All or a filtered subset
5. **Select Fields** — choose All fields or specific attributes (e.g., salary only)
6. Review the summary (records, fields, destination backup info)
7. **Conflict Review** — see conflicts and resolve (details below)

<figure><img src="https://2094208261-files.gitbook.io/~/files/v0/b/gitbook-x-prod.appspot.com/o/spaces%2FCZc46qaaBbVmMuYXPfgz%2Fuploads%2FJvKzZAQX5m7rql5tt7NH%2Fimage.png?alt=media&amp;token=840bb56c-5bc1-460e-ab7a-52d79d183100" alt=""><figcaption></figcaption></figure>

8. Click **Merge**

A backup of the destination scenario is automatically created before merging.

## No Conflicts (Independent Teams)

If the two scenarios modified completely different positions (e.g., one owns Engineering, the other owns Sales), no conflicts appear. Select **Merge All Fields to Destination** and click **Merge**. The merged changes appear as separate org branches — use **Make Root** on each top node if they should remain independent.

## With Conflicts (Overlapping Changes)

Conflicts occur when both scenarios modified the same position (different managers, different salaries, one closed while the other edited).

**Current resolution** — All-or-nothing. "Merge All Fields to Destination" makes the source win for all conflicts. If you want the destination to keep its values, cancel and coordinate manually.

Use the **Show only conflicts** filter to review what you'd be overwriting before deciding.

## When Not to Use Merge

* Scenarios with significant overlap — coordinate in a single shared scenario instead
* Final approved scenarios — don't merge into them; create a new scenario
* Scenarios built on different Main Org baselines

## Troubleshooting

<table><thead><tr><th width="263.3515625">Problem</th><th>Solution</th></tr></thead><tbody><tr><td>Duplicate positions after merge</td><td>Both scenarios created the same new position — delete one duplicate</td></tr><tr><td>Broken hierarchy after merge</td><td>Click the orange broken hierarchy icon > reassign managers to reconnect</td></tr><tr><td>Can't see merged changes</td><td>Clear all filters; confirm <strong>Show After</strong> mode is active</td></tr><tr><td>Merged wrong scenario</td><td>Restore from the automatic backup created before the merge</td></tr></tbody></table>

## Related Articles

* [Scenario Comparisons](/scenarios/comparisons) — Compare without merging
* [Scenario Refresh](/scenarios/advanced-actions/scenario-refresh) — Update scenario with Main Org changes
* [Bulk Operations](/scenarios/using-scenarios-basics/bulk-operations) — Make the same change across multiple positions


# Scenario to Main Org Merge

Implement approved scenarios to your Main Org

Merge an approved scenario into Main Org to make planned changes the new organizational baseline.

**Note:** Scenario to Main org Merge is only used for accounts with no automated integration setup.

**Before you start:**

* Only approved scenarios can be merged
* Only admins can perform this operation
* Merges are permanent

## How to Merge

1. Navigate to **Main Org**
2. Open toolbar > **Data Management** > **Merge Approved Scenarios to Main**

<figure><img src="https://2094208261-files.gitbook.io/~/files/v0/b/gitbook-x-prod.appspot.com/o/spaces%2FCZc46qaaBbVmMuYXPfgz%2Fuploads%2FDc9Sj35ZjgXTbNTJCGF5%2Fimage.png?alt=media&amp;token=486ea920-8fd6-41a1-a2f4-283daebdbb81" alt=""><figcaption></figcaption></figure>

3. Select the approved scenario from the list

<figure><img src="https://2094208261-files.gitbook.io/~/files/v0/b/gitbook-x-prod.appspot.com/o/spaces%2FCZc46qaaBbVmMuYXPfgz%2Fuploads%2F8UfLr32bSbpVrTdq9kHz%2Fimage.png?alt=media&amp;token=75560a90-96db-4d4e-aef2-c080351e1c7d" alt=""><figcaption></figcaption></figure>

4. Click **Next**

**Select fields to merge:**

* Select All (recommended) — all scenario changes apply to Main Org

<figure><img src="https://2094208261-files.gitbook.io/~/files/v0/b/gitbook-x-prod.appspot.com/o/spaces%2FCZc46qaaBbVmMuYXPfgz%2Fuploads%2F5nUJyIYq2w4vMtxUDaS0%2Fimage.png?alt=media&amp;token=6fb77602-7642-4158-91ec-b2c1bcfe2f02" alt=""><figcaption></figcaption></figure>

* Selective fields — only chosen fields update (e.g., Department only); useful when a scenario only modeled one type of change

**Include New Positions:**

* Check to bring new positions created in the scenario into Main Org
* Uncheck if new positions were hypothetical only

5. Review conflicts — when the same position was edited in both the scenario and Main Org since the scenario was created, a conflict appears. Click **"Use Scenario Values for All Conflicts"** — approved scenarios should be treated as the source of truth.

<figure><img src="https://2094208261-files.gitbook.io/~/files/v0/b/gitbook-x-prod.appspot.com/o/spaces%2FCZc46qaaBbVmMuYXPfgz%2Fuploads%2FcIJ1fOaHbEJVZ2ePErKd%2Fimage.png?alt=media&amp;token=e62a8430-fd54-4ca9-9847-d56456308b40" alt=""><figcaption></figcaption></figure>

6. Click **Merge to Main**

<figure><img src="https://2094208261-files.gitbook.io/~/files/v0/b/gitbook-x-prod.appspot.com/o/spaces%2FCZc46qaaBbVmMuYXPfgz%2Fuploads%2F4uHWE7zDpJvc2MpyQWzC%2Fimage.png?alt=media&amp;token=96880c46-0852-4290-8790-9e2b9d017095" alt=""><figcaption></figcaption></figure>

7. Wait for completion, then verify changes in Main Org

## Full Org vs. Partial Org Scenarios

The merge process is the same for both. A Partial Org scenario only affects positions within its scope — the rest of Main Org is untouched.

## Before Merging

* Verify the scenario is fully approved
* Review the scenario one more time — open it and check the OpEx Panel for complete impact
* Communicate to affected teams that changes are going live
* Choose your timing — merge during low-activity periods and coordinate with team announcements

## After Merging

* Browse Main Org to confirm changes applied (new positions, reporting changes, modifications)
* Notify stakeholders that changes are live and share the updated org chart if needed
* Archive the scenario or keep it for historical reference

## Troubleshooting

| Problem                               | Solution                                                                                          |
| ------------------------------------- | ------------------------------------------------------------------------------------------------- |
| Scenario doesn't appear in merge list | Verify scenario status = "Approved"; check admin permissions; refresh the page                    |
| New positions didn't merge            | "Include New Positions" was unchecked — create a new scenario with just those positions and merge |
| Some changes didn't apply             | Check which fields were selected; verify conflicts were resolved with scenario values             |
| Merge is taking a long time           | Wait — large orgs with many changes take longer; don't refresh the page                           |

## Related Articles

* [Scenario Approvals](/scenarios/approvals)
* [Scenario Merging](/scenarios/advanced-actions/merging)


# Scenario Refresh

Update an existing scenario with the latest Main Org data

Scenario Refresh lets you update an older scenario with the latest data from your **Main Org** (or the latest synced HRIS data that is now reflected in Main Org).

This is useful when you created a scenario some time ago, but your Main Org has since changed and you want to bring those updates into the scenario without starting over.

With Scenario Refresh, you can control:

* **which position /** **people** get refreshed
* **which fields** get refreshed
* whether to **keep scenario values** or **overwrite with Main Org**
* whether to include **new joiners** that are now part of the scenario scope

Agentnoon also creates a **backup scenario automatically** before refresh is applied, so you can go back if needed.

## When to use Scenario Refresh

Use Scenario Refresh when:

* your scenario was created weeks or months ago
* Main Org has newer data than your scenario
* new fields have been added to Main Org
* new employees have joined and should be pulled into the scenario
* you want to update selected fields without recreating the scenario

Examples:

* new people joined the team after the scenario was created
* department, role, or manager data changed in Main Org
* new custom fields were added and now need to appear in the scenario
* you want the scenario to reflect the latest HRIS sync before continuing planning

### How to refresh a scenario

#### Step 1: Open the scenario

Go to the scenario you want to refresh.

#### Step 2: Open Data Management

From the left toolbar, click **Data Management**.

#### Step 3: Click Refresh Scenario

Select **Refresh Scenario**.

You’ll now see:

* **Main Org** on the left
* **Your scenario** on the right

This view helps you compare your current scenario against the latest main data.

<figure><img src="https://2094208261-files.gitbook.io/~/files/v0/b/gitbook-x-prod.appspot.com/o/spaces%2FCZc46qaaBbVmMuYXPfgz%2Fuploads%2FkKyShpj2iTOL5qocIAt1%2FScreenshot%202026-03-26%20at%204.06.25%E2%80%AFPM.png?alt=media&amp;token=5e1da2c4-2fab-439f-811c-f062b9aa0316" alt=""><figcaption></figcaption></figure>

### Step 1 of refresh: Select people

In the first step, choose which people should be refreshed.

You can:

* select all people already in the scenario
* include newly joined people from Main Org
* search by:
  * name
  * role
  * department
* apply filters to narrow the list

This is especially useful if only part of the org has changed and you do not want to refresh the full scenario.

<figure><img src="https://2094208261-files.gitbook.io/~/files/v0/b/gitbook-x-prod.appspot.com/o/spaces%2FCZc46qaaBbVmMuYXPfgz%2Fuploads%2FwwmV9RlNqdtXsln5sCkP%2FScreenshot%202026-03-26%20at%204.07.38%E2%80%AFPM.png?alt=media&amp;token=701dd170-49bb-4360-a3b5-37f79b8c61d3" alt=""><figcaption></figcaption></figure>

### Step 2 of refresh: Select fields

Next, choose which fields should be refreshed.

You can:

* select specific fields only
* use **Select All** to refresh every available field

This includes:

* existing fields already present in the scenario
* **new fields that now exist in Main Org** but were not present when the scenario was created

Example:\
If Main Org now contains a field such as **Performance Review** or **New Attribute**, those fields will appear in the field list during refresh and can be added into the scenario.

<figure><img src="https://2094208261-files.gitbook.io/~/files/v0/b/gitbook-x-prod.appspot.com/o/spaces%2FCZc46qaaBbVmMuYXPfgz%2Fuploads%2FtIk82r4RifK1TFqJvSb7%2FScreenshot%202026-03-26%20at%204.08.22%E2%80%AFPM.png?alt=media&amp;token=00b82c8e-aac3-4c10-a5ed-37cc7d694a9b" alt=""><figcaption></figcaption></figure>

### Step 3 of refresh: Review conflicts and summary

Before confirming, Agentnoon shows a summary of what will change.

This includes:

* **Total headcount before vs. after**
* **Total compensation before vs. after**
* **Number of fields refreshed**
* **People with manager changes**
* **a preview of which fields and values are changing**

This is the review step where you can decide how to handle conflicts.

<figure><img src="https://2094208261-files.gitbook.io/~/files/v0/b/gitbook-x-prod.appspot.com/o/spaces%2FCZc46qaaBbVmMuYXPfgz%2Fuploads%2FSI0mPUZFGM1MMhkSJJ4H%2FScreenshot%202026-03-26%20at%204.08.58%E2%80%AFPM.png?alt=media&amp;token=a2abc3a7-bc26-406b-89d1-14dd8cac6c5a" alt=""><figcaption></figcaption></figure>

### Keep Scenario Values vs. Overwrite with Main Org

For each field, you can choose:

#### Keep Scenario Values

Use this when you want to preserve edits already made inside the scenario.

#### Overwrite with Main Org

Use this when you want the scenario to take the latest value from Main Org.

Example:\
If your scenario already contains a custom value for `New Attribute`, but Main Org now has a newer value, you can decide whether to:

* keep the scenario’s version, or
* replace it with the latest Main Org value

<figure><img src="https://2094208261-files.gitbook.io/~/files/v0/b/gitbook-x-prod.appspot.com/o/spaces%2FCZc46qaaBbVmMuYXPfgz%2Fuploads%2F6aq7HUToRM3gC0mJ1UP3%2FScreenshot%202026-03-26%20at%204.11.37%E2%80%AFPM.png?alt=media&amp;token=4e970145-3598-4ae0-96cf-461e1e43c499" alt=""><figcaption></figcaption></figure>

### Step 4: Confirm and Refresh

When you’re ready:

1. Click **Next**
2. Review the final summary
3. Click **Confirm and Refresh**

Before refresh is applied, Agentnoon automatically creates a **backup scenario** of your original version.

This gives you a recovery point in case you want to undo the refresh later.

<figure><img src="https://2094208261-files.gitbook.io/~/files/v0/b/gitbook-x-prod.appspot.com/o/spaces%2FCZc46qaaBbVmMuYXPfgz%2Fuploads%2FPI7FB33Ruqed7Y9idsBE%2FScreenshot%202026-03-26%20at%204.12.06%E2%80%AFPM.png?alt=media&amp;token=c710af67-99d6-4493-9e0c-d23924f60cde" alt=""><figcaption></figcaption></figure>

### What happens after refresh

Once refresh is complete:

* your scenario is updated with the selected Main Org data
* newly selected people are added into the scenario
* newly selected fields become available in the scenario
* the refreshed values are visible across the scenario views

You may also see a scenario status tag such as **Refreshed by…** for newly added people.

## Full Org vs. Partial Org scenarios

Scenario Refresh behaves slightly differently depending on how the scenario was created.

### Refreshing a Full Org scenario

In a Full Org scenario:

* you can refresh all current people in the scenario
* you can also bring in new joiners from Main Org
* you can select any relevant fields to refresh

This is the most flexible version of Scenario Refresh because the scenario already represents the full workforce scope.

### Refreshing a Partial Org scenario

In a Partial Org scenario, refresh is limited to the **original scenario scope**.

For example:

* if the scenario was created only for the **IT department**
* Scenario Refresh will only show:
  * people already in the IT scenario
  * new people who joined the IT department
* it will **not** show people from Engineering, Sales, or other departments outside the original scenario scope

This is intentional and keeps the partial scenario aligned to its original filter boundaries.

### Important limitation for Partial Org scenarios

If you want to bring in people from outside the original scenario scope, Scenario Refresh is **not** the right feature.

Best practice:

1. Create another scenario for that additional group
2. Use **Scenario Merging** to combine them

Example:\
If your current scenario is for IT only, and you now want to include new Engineering employees, create an Engineering scenario separately and merge it with the IT scenario.

### Common workflow example

#### Refresh an old scenario with new fields and new joiners

1. Open the old scenario
2. Go to **Data Management → Refresh Scenario**
3. Select all current people in the scenario
4. Select any new joiners from Main Org
5. Choose the fields to refresh
6. Review the summary
7. Decide which fields should:
   * keep scenario values, or
   * overwrite with Main Org
8. Confirm the refresh
9. Continue planning using the updated scenario

### Best practices

#### Refresh before major planning work

If your scenario is old, refresh it before making large changes so you are planning on the latest data.

#### Refresh only the fields you need

If you want to preserve certain scenario edits, avoid selecting fields unnecessarily.

#### Use conflict handling carefully

Only overwrite with Main Org when you are sure the latest source data should replace scenario edits.

#### Review new fields before confirming

If Main Org now includes new attributes, decide whether they should be added into the scenario during this refresh.

#### Use partial scenarios carefully

Remember that partial org refresh only pulls changes within the scenario’s original filter scope.

#### Rely on the backup

If you are unsure, proceed with refresh knowing a backup scenario is created automatically.

### Limitations

* Scenario Refresh only updates the scenario based on the latest **Main Org** data
* Partial org scenarios only refresh within their original scope
* If you want to include people outside that scope, create another scenario and merge it
* Refresh does not replace the need for Scenario Merging when combining broader workforce segments

## Related Articles

* [Scenario Approvals](/scenarios/approvals)
* [Scenario Merging](/scenarios/advanced-actions/merging)


# Partial Data Upload

Update specific fields or add new records without re-uploading your entire dataset.

Partial Upload lets you update select records or append new ones to your Agentnoon org chart without importing your full data file.

**Common use cases:**

* Update specific employee information (titles, salaries, departments)
* Add new hires without re-uploading the entire organization
* Add an acquired company's org alongside your existing org (M\&A integration)
* Bulk update specific attributes across multiple employees
* Add temporary or contractor positions
* Append new departments or business units

**Key benefits:**

* No need to re-upload your entire dataset
* Faster than a full data import
* Updates or adds only what you specify
* Existing data remains unchanged unless explicitly updated

## When to Use Partial Upload vs Full Data Import

| Use Partial Upload when                         | Use Full Data Import when                               |
| ----------------------------------------------- | ------------------------------------------------------- |
| Updating specific employee attributes           | Setting up Agentnoon for the first time                 |
| Adding new hires or positions                   | Refreshing the entire dataset from your HRIS            |
| Adding an acquired company for M\&A integration | Major restructuring affecting the entire company        |
| Appending a new business unit or department     | Correcting fundamental data issues across all employees |
| Bulk updating a subset of employees             | Starting fresh after major changes                      |

**General rule:** Use Partial Upload for targeted changes, Full Import for complete replacement.

## Permissions

Partial Uploads can be performed by administrators and users with data management permissions. To request access, contact your Agentnoon administrator.

**Security considerations:**

* Partial uploads can modify org data and should be restricted to trusted users
* Consider an approval workflow for major uploads
* An audit trail tracks who uploaded what and when

### Prepare Your Partial Dataset

To use the partial approach:

1. Navigate to the **scenario** where you want to perform updates.
2. Go to **Data Management**.
3. Locate the option labeled **“Upload Partial Data.”**

Before proceeding, the system typically displays warnings and informational notes. These are important and should be reviewed carefully to avoid data inconsistencies.

#### **Download the Baseline File**

Start by downloading the **baseline dataset**, which serves as your reference point. You can choose between:

* **Position data**
* **Employee data**

Update the spreadsheet with only the records you want to update or add.

1. Include only the fields that need to be updated (e.g. Name, Job Title).
2. Ensure each row includes a unique identifier (like Employee ID or Position ID or Agentnoon ID).
3. For new positions/employees, include a Manager ID to correctly place them in the org chart.\
   ***Note: Records without a manager may appear detached from the structure.***

<div><figure><img src="https://2094208261-files.gitbook.io/~/files/v0/b/gitbook-x-prod.appspot.com/o/spaces%2FCZc46qaaBbVmMuYXPfgz%2Fuploads%2FIohuOBjSFj7SIWFYbKgs%2FScreenshot%202025-04-30%20at%206.27.08%E2%80%AFPM.png?alt=media&amp;token=a2d330d1-b9fb-429d-b227-3fbe9898c6f5" alt=""><figcaption><p>Example: Original employee dataset</p></figcaption></figure> <figure><img src="https://2094208261-files.gitbook.io/~/files/v0/b/gitbook-x-prod.appspot.com/o/spaces%2FCZc46qaaBbVmMuYXPfgz%2Fuploads%2F8GyF5xMpTmG2I3Izj1qL%2FScreenshot%202025-04-30%20at%206.29.06%E2%80%AFPM.png?alt=media&amp;token=74d006fa-7a0d-4df0-aeb5-92c4298e76d2" alt=""><figcaption><p>Example: Edited partial upload dataset</p></figcaption></figure></div>

#### **Uploading the File**

1. Click to upload the file or drag and drop the file (CSV).

<figure><img src="https://2094208261-files.gitbook.io/~/files/v0/b/gitbook-x-prod.appspot.com/o/spaces%2FCZc46qaaBbVmMuYXPfgz%2Fuploads%2Foj6reS4KqEKUJwCpewWq%2Fimage.png?alt=media&amp;token=9843689f-c8b1-48a4-a67d-f468d5849c10" alt=""><figcaption></figcaption></figure>

### Mapping Changes

Map records to update

1. **Select a unique identifier** (e.g., Employee ID or Position ID) so Agentnoon knows which existing records to update.
2. Agentnoon auto-detects the fields present in your partial file and pre-selects them for update. \
   ***Note: You don’t need to re-map fields that haven’t changed.***
3. Review the selected fields and make adjustments if needed before continuing.<br>

   <figure><img src="https://2094208261-files.gitbook.io/~/files/v0/b/gitbook-x-prod.appspot.com/o/spaces%2FCZc46qaaBbVmMuYXPfgz%2Fuploads%2F8NffMwhvcNzc27iZmga0%2FScreenshot%202025-11-11%20at%205.40.29%E2%80%AFPM.png?alt=media&amp;token=692e9e39-f1fc-4097-b7e7-0ed4866e0b81" alt=""><figcaption></figcaption></figure>

Once the upload completes, your data will be refreshed. Existing records will update, and any new records will appear in the org chart. You can identify which cards have changed by looking for the orange edit icon in the bottom-left corner.

<figure><img src="https://2094208261-files.gitbook.io/~/files/v0/b/gitbook-x-prod.appspot.com/o/spaces%2FCZc46qaaBbVmMuYXPfgz%2Fuploads%2FMo9rscvF8UQxySgR866i%2Fimage.png?alt=media&amp;token=ef8936ba-3e5e-4b01-9f28-253b2114d54e" alt=""><figcaption></figcaption></figure>

## Advanced Partial Upload Scenarios

#### **Adding a new business unit**

Prepare a file with the new unit's positions and reporting structure. Define the entry point (which existing leader the new unit reports to). Use Partial Upload to append the unit, then verify it appears in the correct location in the org chart.

#### **Bulk attribute updates**

Export current data or create a file with just the employees to update. Include only the unique identifier and the fields that need changing — all other fields remain unchanged. Examples: updating 50 employees with new titles after reclassification, adjusting salaries for an entire department after a market adjustment, or moving a team from Department A to Department B.

#### **Adding seasonal or contract workers**

&#x20;Prepare a file with contractor or seasonal employee data. Include an Employee Type attribute (e.g., "Contractor", "Seasonal"). Use Partial Upload to add these positions, then filter by Employee Type to show or hide the temporary workforce.

## Use Case: M\&A Integration

Partial Upload is the recommended approach for adding an acquired company's org alongside your existing one. Unlike a standard data import — which replaces your entire Main Org — Partial Upload adds the acquired company's data without touching your existing organization. Both orgs exist side-by-side in Main Org, allowing you to model integration in scenarios.

#### **Step 1: Prepare acquired company data**

Export the acquired company's org structure, including:

* All employees and positions
* Manager relationships
* Departments and locations
* Titles and compensation
* Any custom attributes

**Critical:** Add a "Company" or "Original Organization" column with the value set to the acquired company's name. This lets you filter and distinguish between organizations.

<figure><img src="https://2094208261-files.gitbook.io/~/files/v0/b/gitbook-x-prod.appspot.com/o/spaces%2FCZc46qaaBbVmMuYXPfgz%2Fuploads%2FWcBnZPFilmYYQN9hgnkc%2Fimage.png?alt=media&amp;token=2d1d9903-4c5c-4cfb-95a1-1beacdf74e36" alt=""><figcaption></figcaption></figure>

#### **Step 2: Perform Partial Upload**

1. Navigate to **Data Management** → **Partial Upload**
2. Upload the acquired company file
3. Map fields to Agentnoon attributes
4. Ensure unique identifiers don't conflict with existing employees
5. Confirm and process the upload

#### **Step 3: Verify both orgs exist**

1. Navigate to Main Org > **Directory**
2. Filter by the "Company" attribute
3. Verify both organizations appear
4. Check that total headcount includes both orgs

#### **Step 4: Create an integration scenario**

1. Create a new scenario for M\&A integration
2. Both orgs are visible as the starting state
3. Model consolidation, redundancy elimination, and combined structure
4. Use effective dates to phase the integration

**Learn more:** [M\&A Integration Tutorial](/reference-guides/overview/ma-integration)

## Best Practices

**Use unique identifiers** — Always include Employee ID, Position ID, or a guaranteed-unique email address. Without them, Agentnoon may create duplicate records instead of updating existing ones.

**Test first** — For major partial uploads, test with 5–10 records first. Verify the upload behaves as expected and check for duplicates or unexpected changes before uploading the full dataset.

**Back up before uploading** — Duplicate your Main Org as a scenario before any major partial upload. If the upload has issues, you have a reference to the original state.

**Validate your data** — Before uploading, check for missing required fields, verify manager relationships are valid, ensure unique identifiers are correct, validate data types, and remove any test or dummy data.

**Communicate major changes** — For uploads affecting many users, notify stakeholders before uploading, communicate what's changing and why, and provide a timeline for when changes will appear.

## Troubleshooting

| Problem                               | Cause                                                                           | Solution                                                                                                                                             |
| ------------------------------------- | ------------------------------------------------------------------------------- | ---------------------------------------------------------------------------------------------------------------------------------------------------- |
| Duplicate records created             | Unique identifier not mapped correctly or identifiers don't match between files | Delete duplicates; re-upload with correct identifier mapping; ensure Employee ID/Position ID values match exactly                                    |
| New records don't appear in org chart | Missing manager relationship or invalid Manager ID                              | Check that Manager ID exists in your org; verify manager field is mapped correctly; detached records appear at top level until a manager is assigned |
| Updates don't apply                   | Unique identifier not found in existing data                                    | Verify identifier values match exactly (no extra spaces, case-sensitive); check that the records you're updating actually exist                      |
| Wrong fields updated                  | Field mapping incorrect during upload                                           | Review field mapping carefully before confirming; cancel and restart if mapping looks wrong                                                          |
| M\&A upload replaces existing org     | Standard data import used instead of Partial Upload                             | Contact Agentnoon support to restore if recent; always use the Partial Upload workflow specifically                                                  |

## Related Articles

* [M\&A Integration Tutorial](/reference-guides/overview/ma-integration) - Complete M\&A workflow using Partial Upload
* [Data Import](/admin-capabilities/overview-2/data-import) - Full data import process
* [Data Requirements](/admin-capabilities/overview-2/data-requirements) - Required fields and formatting
* [Data Error Checklist](/admin-capabilities/overview-2/data-error-checklist) - Troubleshooting data issues


# Directory Overview

Introduction to directory and table views

The Directory is your dedicated table view for analyzing organizational data. While the org chart visualizes hierarchy, Directory provides a spreadsheet-style interface for sorting, filtering, and exporting position and people data.

<figure><img src="https://2094208261-files.gitbook.io/~/files/v0/b/gitbook-x-prod.appspot.com/o/spaces%2FCZc46qaaBbVmMuYXPfgz%2Fuploads%2F9nNuJm2MxzLVlxBSKmPA%2Fimage.png?alt=media&amp;token=172d0b24-4fba-48b1-8fd3-f35cf3aeab62" alt=""><figcaption></figcaption></figure>

## Directory vs Org Chart

| Feature                  | Directory              | Org Chart                   |
| ------------------------ | ---------------------- | --------------------------- |
| Format                   | Table (rows/columns)   | Visual hierarchy            |
| Best for                 | Data analysis          | Understanding relationships |
| Sorting                  | ✅ Yes                  | ❌ No                        |
| Multiple columns visible | ✅ Many at once         | ⚠️ Limited (card space)     |
| See reporting structure  | ⚠️ Manager column only | ✅ Visual lines              |
| Find outliers            | ✅ Easy (sort high/low) | ⚠️ Manual search            |

## When to Use Directory

* **Analyze data** — Sort by salary, tenure, pay grade to find outliers and highest/lowest values
* **Create exports** — Department rosters, contact lists, filtered position lists
* **Multi-column comparison** — View many attributes simultaneously
* **Quick lookups** — Find all managers in a location, identify vacant positions
* **Bulk operations** *(scenarios only)* — Select and edit multiple positions at once

## Directory Capabilities

| Feature                     | Learn More                                                      |
| --------------------------- | --------------------------------------------------------------- |
| Orientation & Navigation    | [Navigation & Access](/directory/navigation)                    |
| Filtering & Sorting         | [Filtering & Sorting](/directory/filtering-sorting)             |
| Column Customization        | [Column Customization](/directory/columns-customization)        |
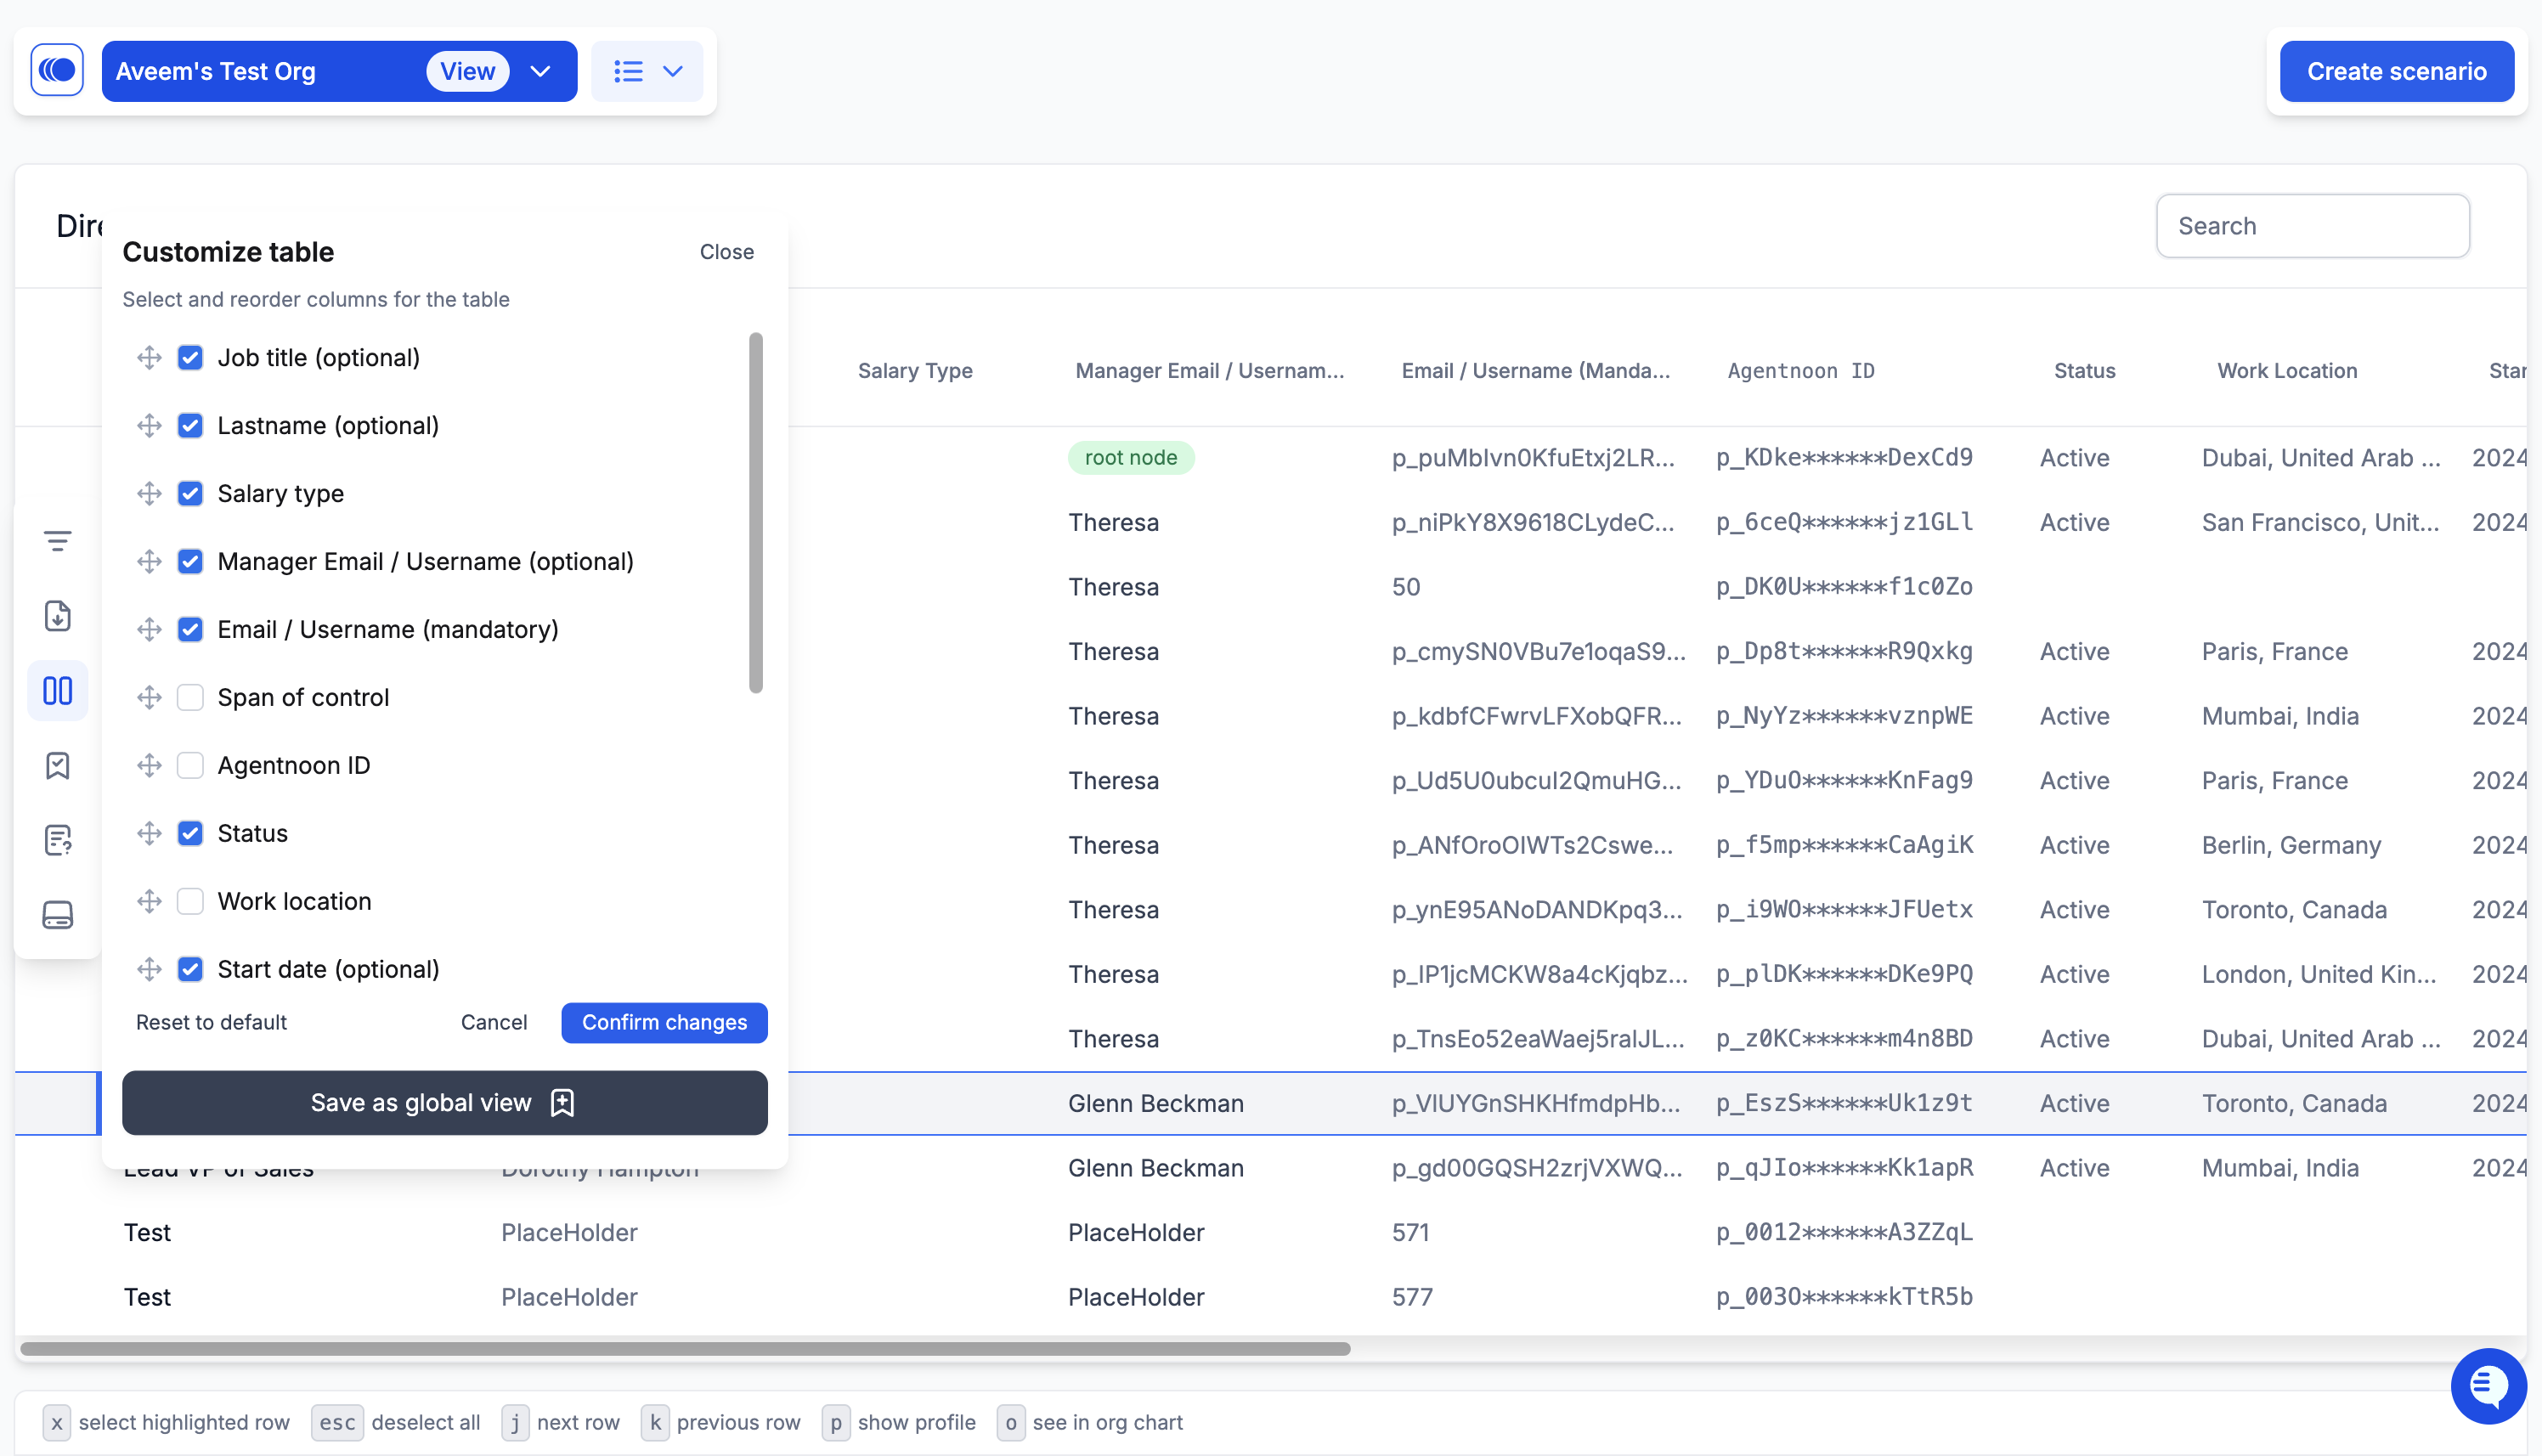
| Bulk Operations (scenarios) | [Bulk Operations](/directory/bulk-operations)                   |
| Exporting Data              | [Exporting Data from Directory](/directory/exporting-reporting) |

## Common Workflows

**Find highest-paid positions** — Sort the Salary column high to low.

**Export a department roster** — Filter to Department = Engineering > show Name, Title, Email, Manager > Export CSV.

**Identify vacant positions** — Filter Employee Name = (empty) > sort by Department > review or export.

**Analyze pay equity** — Filter to Job Title = "Software Engineer" > sort by Salary > compare across departments.

**Find compression opportunities** — Filter to Direct SOC = 1–2 > sort by Pay Grade (high to low).

## Best Practices

* Use Directory for data analysis — table format is better for sorting and comparing numbers
* Use Org Chart for relationships — visual format is better for understanding hierarchy
* Filter before exporting — narrow to what you need rather than exporting everything
* Customize columns for your task — show only relevant attributes
* Remember that active filters carry over between Org Chart and Directory views

<figure><img src="https://2094208261-files.gitbook.io/~/files/v0/b/gitbook-x-prod.appspot.com/o/spaces%2FCZc46qaaBbVmMuYXPfgz%2Fuploads%2F6RPtGIH4zotRJRrNt6CO%2Fimage.png?alt=media&amp;token=33b0ce54-ebb6-420e-b174-341b94a55bba" alt=""><figcaption></figcaption></figure>


# Orientation & Navigation

Accessing Directory and switching between views

## Directory Modes

**Main Org Directory (view-only)** — Sort, filter, search, and export. No editing. Use for current state analysis and reporting.

**Scenario Directory (editable)** — Everything above plus bulk select, bulk edit, and add/close positions. Use for planning org changes.

## Accessing Directory

* **From the homepage** — Click Directory in the top nav bar, or press `2`
* **From Main Org or Scenario** — Click the Directory/Table icon in the left toolbar (toggles with org chart; filters persist)
* **From Workforce Hub** — Some charts include a "View in Directory" link that opens Directory pre-filtered to the chart's data

## Navigating Large Datasets

Pagination — Change rows per page (25/50/100/500) at the bottom of the table. Sorting works across all pages, not just the current one.

:bulb: **Protip:** Filter first to reduce total rows, then sort the filtered subset — much faster than paginating through 800+ positions.

## Keyboard Shortcuts

| Action                          | Shortcut |
| ------------------------------- | -------- |
| Jump to Directory module        | `2`      |
| Return to Org Chart             | `1`      |
| Clear selection or close panels | `Esc`    |

## Troubleshooting

| Problem                                    | Solution                                                       |
| ------------------------------------------ | -------------------------------------------------------------- |
| Directory empty or showing unexpected data | Check active filters; clear all and try again                  |
| Can't find toolbar icons                   | Scroll up to see the left toolbar; try collapsing other panels |

## Related Articles

* [Filtering & Sorting](/directory/filtering-sorting)
* [Column Customization](/directory/columns-customization)
* [Bulk Operations](/directory/bulk-operations)
* [Exporting](/main-org/exporting)


# Filtering & Sorting

Filtering positions and sorting columns in Directory

## Sorting

Click a column header to sort ascending (↑); click again to sort descending (↓); click a third time to remove the sort.

## Filtering

1. Click the **Filter** icon

<figure><img src="https://2094208261-files.gitbook.io/~/files/v0/b/gitbook-x-prod.appspot.com/o/spaces%2FCZc46qaaBbVmMuYXPfgz%2Fuploads%2FtHW3s61UBs7vQtlaShj8%2Fimage.png?alt=media&amp;token=caa51a5a-b3e6-4a7d-9b83-293003f1ddfc" alt=""><figcaption></figcaption></figure>

2. Select an attribute (Department, Location, Pay Grade, etc.)
3. Choose values to include
4. Click **Apply**

Active filters appear as tags above the table. Multiple filters use AND logic — all conditions must be true. Click the **X** on any tag to remove it; use **Clear All** to reset.

* **Filter by calculated fields** — Direct SOC = 1–2 (low spans), Layer = 6+ (deep org), Total Org Size > 50 (large orgs)
* **Filter by empty values** — Employee Name = (empty) finds vacant positions

**Note:** Active filters persist across Directory and Org Chart views. Always check for active filters if data looks unexpected.

## Search

Type in the search box to find positions by name, title, or any attribute. Partial matches work and search is case-insensitive. Search only scans currently filtered (visible) rows.

<figure><img src="https://2094208261-files.gitbook.io/~/files/v0/b/gitbook-x-prod.appspot.com/o/spaces%2FCZc46qaaBbVmMuYXPfgz%2Fuploads%2FRsoxGGMa64gD6utYHcVq%2Fimage.png?alt=media&amp;token=9334df4e-121e-4201-ba86-23febd35f97b" alt=""><figcaption></figcaption></figure>

## Common Workflows

**Analyze department compensation** — Filter = Department > Sort = Salary (high→low) > Export CSV.

**Find compression** — Filter = Direct SOC = 1–2 AND Pay Grade > 12 > Sort = Layer (low→high).

**Vacancy list for recruiting** — Filter = Employee Name = (empty) > Sort = Department (A→Z) > Export CSV.

**Pay equity check** — Filter = Job Title = "Software Engineer" > Sort = Salary (high→low) to compare across departments and locations.

**Find recent hires** — Sort = Start Date (newest→oldest).

## Troubleshooting

| Problem                        | Solution                                                 |
| ------------------------------ | -------------------------------------------------------- |
| Can't find expected positions  | Check active filters; clear all and search again         |
| Sort not working               | Remove existing sort (click header 3×), then re-sort     |
| Filter options missing a value | That value doesn't exist in the data — check your import |
| Search returns no results      | Search only scans filtered rows; clear filters and retry |

## Related Articles

* [Column Customization](/directory/columns-customization)
* [Bulk Operations](/directory/bulk-operations)


# Column Customization

Customizing visible columns, reordering, and resizing in Directory

Control which columns appear in Directory, their order, and their widths to create focused views for different tasks.

<figure><img src="https://2094208261-files.gitbook.io/~/files/v0/b/gitbook-x-prod.appspot.com/o/spaces%2FCZc46qaaBbVmMuYXPfgz%2Fuploads%2FtR5ZN84L286u2l3a9p3b%2Fimage.png?alt=media&amp;token=ef21f007-8bdc-4083-9c2c-88c01fae1e11" alt=""><figcaption></figcaption></figure>

## Show / Hide Columns

Click the **Column Settings** icon (gear or **⋮**) > check/uncheck columns. Changes apply immediately. Only visible columns are included in exports.

## Reorder Columns

Drag column headers left or right to reorder. Put identifying info (Name, Title) leftmost, group related fields together, and put analysis fields after.

## Resize Columns

Drag the border between column headers to resize manually. Double-click the border to auto-fit to content width.

## Column Types

* **Text** — Name, Title, Department. Sort alphabetically; filter by value.
* **Numeric** — Salary, Pay Grade, SOC, Layer. Sort by value; filter by range.
* **Date** — Start Date. Sort chronologically; filter by range.
* **Calculated** — Direct SOC, Total Org Size, Layer, Tenure. Computed by Agentnoon; read-only but sortable and filterable.

## Common Column Configurations

**Basic view** — Name, Title, Department, Manager. For quick reference and org structure.

**Compensation view** — Name, Title, Department, Pay Grade, Salary. For pay equity and budget analysis.

**Contact list** — Name, Email, Manager, Location, Phone. For rosters and email distributions.

**Span of control** — Name, Title, Department, Layer, Direct SOC, Total Org Size. For compression and org design analysis.

**Vacancy tracking** — Position Title, Department, Manager, Employee Name (blank = vacant), Start Date. For recruiting planning.

**Scenario changes** — Name, Change Type, Old Values, New Values, Cost Impact. For reviewing and approving scenario changes.

## Saving Views

Save your column configuration as a named view via **Views** > **Save Current View** to quickly reload it later. Create separate views for different tasks — Compensation Analysis, Contact Lists, SOC Review, and so on.

<figure><img src="https://2094208261-files.gitbook.io/~/files/v0/b/gitbook-x-prod.appspot.com/o/spaces%2FCZc46qaaBbVmMuYXPfgz%2Fuploads%2FpIgPHooDKoAKAXlIK9i2%2FScreenshot%202026-03-06%20at%2012.09.15%E2%80%AFPM.png?alt=media&amp;token=711144a9-7fc9-4d40-998f-3082f22e6453" alt=""><figcaption></figcaption></figure>

## Troubleshooting

<table><thead><tr><th width="258.140625">Problem</th><th>Solution</th></tr></thead><tbody><tr><td>Can't find a specific column</td><td>Click column settings and scroll through all available columns</td></tr><tr><td>Column order resets</td><td>Save as a view — column order may not persist across sessions</td></tr><tr><td>Text truncated with "..."</td><td>Drag the column border wider or double-click to auto-fit</td></tr><tr><td>Too many columns</td><td>Hide less important ones; scroll horizontally for overflow</td></tr></tbody></table>

## Related Articles

* [Filtering & Sorting](/directory/filtering-sorting)
* [Navigation & Access](/directory/navigation)


# Bulk Operations

Selecting multiple positions and performing bulk edits in Scenario Directory

Bulk operations in Directory let you select multiple positions and apply changes simultaneously. Available in Scenario Directory only — not in Main Org Directory (view-only).

## Selecting Positions

* **Single** — Click a row to select it
* **Multiple** — Check the checkboxes in the first column
* **All visible** — Check the header checkbox — selects all rows matching current filters only (not hidden rows). Always filter to your intended subset before using Select All.
* **Range** — `Shift+click` to select a range of rows

## Bulk Edit Actions

After selecting positions, click **Bulk Edit** to apply changes:

* **Department, Location, Pay Grade, Manager, custom fields** — Change the value for all selected positions simultaneously
* **Salary adjustments** — Apply a flat amount or percentage increase to all selected positions
* **Close positions** — Mark multiple positions as closed (RIF reason); tracked in the OpEx Panel as cost savings

<figure><img src="https://2094208261-files.gitbook.io/~/files/v0/b/gitbook-x-prod.appspot.com/o/spaces%2FCZc46qaaBbVmMuYXPfgz%2Fuploads%2Fg4Y6DA8MyegbdrM5jgMg%2Fimage.png?alt=media&amp;token=ccf22608-065b-4e6d-8103-1e30c2b5bd06" alt=""><figcaption></figcaption></figure>

A preview shows which positions will change and their old/new values — review before confirming.

## Common Workflows

**Move a team to a new manager** — Filter by Manager = \[old manager] > Select All > Bulk Edit > Manager > \[new manager]

**Apply merit increases by pay grade** — Filter by Pay Grade = 10 > Select All > Bulk Edit > Salary > +3% > repeat for other grades

**Close positions for RIF** — Filter by department + criteria > select target positions > Bulk Close > RIF reason > verify cost impact in OpEx Panel

**Relocate a remote team** — Filter to Department + Location = Remote > Select All > Bulk Edit > Location > \[office city]

## Change Tracking

All bulk changes are tracked in the OpEx Panel — change type, old and new values, and timestamp. Review there after applying bulk edits to verify the expected impact.

## Troubleshooting

<table><thead><tr><th width="336.53125">Problem</th><th>Solution</th></tr></thead><tbody><tr><td>No checkboxes / Bulk Edit button missing</td><td>Must be in Scenario Directory — Main Org Directory is view-only</td></tr><tr><td>Select All doesn't select everyone</td><td>Only selects visible (filtered) rows — clear filters to expand selection</td></tr><tr><td>Bulk edit applied wrong changes</td><td>Use Undo immediately, or restore from a scenario duplicate made before the operation</td></tr><tr><td>Changes not in OpEx Panel</td><td>Refresh the tracker panel; verify changes were applied by reviewing positions individually</td></tr></tbody></table>

## Related Articles

* [Scenario Directory](/scenarios/directory)
* [Filtering & Sorting](/directory/filtering-sorting)


# Exporting Data from Directory

Getting data out of Directory for analysis, presentations, and reports

Export organizational data from Directory, Org Chart, and Workforce Hub for analysis, presentations, and reports.

## Export Formats

**CSV** — Raw data from the current view; respects active filters and visible columns. Best for Excel/Sheets analysis, BI tools, and importing into other systems.

**PowerPoint** — Org chart structured as slides (one slide per manager). Best for executive presentations and leadership reviews.

**JPEG/PNG** — Screenshot of the current org chart view. Best for quick sharing, email, or embedding in documents.

## Exporting from Directory

1. Apply filters to narrow data
2. Customize visible columns (show/hide, reorder) — exports include only visible columns
3. Sort as desired
4. Click **Export** > **CSV**

<figure><img src="https://2094208261-files.gitbook.io/~/files/v0/b/gitbook-x-prod.appspot.com/o/spaces%2FCZc46qaaBbVmMuYXPfgz%2Fuploads%2FJkRVr7cUfT5PGhCqd5Gi%2Fimage.png?alt=media&amp;token=2971fcca-b4a3-4c03-aad8-391027ebd2b8" alt=""><figcaption></figcaption></figure>

**Admin export templates:** Admins can configure standardized export templates with preset columns and filters for one-click exports used across the team.

## Exporting from Org Chart

**JPEG** — Apply highlights and adjust zoom/layout, then **Export** > **JPEG**.

**PowerPoint** — **Export** > **PowerPoint** > configure scope (full org or filtered), hierarchy depth, layout, slide depth, and card content.

**CSV** — Apply filters, then **Export** > **CSV** — includes all visible positions with their attributes.

<figure><img src="https://2094208261-files.gitbook.io/~/files/v0/b/gitbook-x-prod.appspot.com/o/spaces%2FCZc46qaaBbVmMuYXPfgz%2Fuploads%2FoiL4vjqenSHN5Qn4nHXU%2Fimage.png?alt=media&amp;token=071e0728-f9a9-42df-859b-dd8cd2394283" alt=""><figcaption></figcaption></figure>

## Exporting from Workforce Hub

**PNG** — Configure the chart > click the Download icon > **PNG**. High-resolution for presentations.

**PowerPoint** — Download icon > **PowerPoint** — exports an editable chart object, not just an image.

**CSV (underlying data)** — Click **Show Table** first > Download icon > **CSV**. Use for deeper analysis in Excel or BI tools.

<figure><img src="https://2094208261-files.gitbook.io/~/files/v0/b/gitbook-x-prod.appspot.com/o/spaces%2FCZc46qaaBbVmMuYXPfgz%2Fuploads%2FfXigLbyMq8WyelKoIB6j%2Fimage.png?alt=media&amp;token=86fb5869-3808-4726-919a-bad49578d928" alt=""><figcaption></figcaption></figure>

## Common Export Workflows

**Department roster** — Directory > Filter by Department > show Name, Title, Manager, Email, Location > Export CSV.

**Org chart for executive presentation** — Main Org > Filter to top 3 layers > apply Department highlighting > Export PowerPoint.

**Compensation analysis** — Directory > show Department, Pay Grade, Salary, Title > sort > Export CSV.

**Open positions / vacancy report** — Directory > Filter Employee Name = (empty) > show Job Title, Department, Manager, Pay Grade > Export CSV for recruiting.

**Span of control report** — Directory > Filter Direct SOC = 1–2 > show Name, Title, Department, Direct SOC, Pay Grade > Export CSV.

## Best Practices

* Filter and customize columns before exporting — don't export everything and filter in Excel
* Include the export date in filenames: `Engineering-Roster-2026-02-20.csv`
* Handle salary and personal data according to your organization's data security policies

## Troubleshooting

| Problem                               | Solution                                                    |
| ------------------------------------- | ----------------------------------------------------------- |
| Columns missing from export           | Check column settings — only visible columns are exported   |
| Too much data                         | Apply filters before exporting                              |
| Org chart looks different than screen | Use **Fit to Screen** first; adjust layout before exporting |
| PowerPoint has too many slides        | Filter to a smaller scope (one department or top layers)    |
| Missing people                        | Check active filters; clear them and try again              |

## Related Articles

* [Directory Filtering & Sorting](/directory/filtering-sorting)
* [Main Org Exporting](/main-org/exporting)
* [Scenario Exporting](/scenarios/exporting)


# Workforce Hub Overview

Introduction to the Workforce Hub and available analytics charts

## What is the Workforce Hub?

The **Workforce Hub** is Agentnoon's analytics center for understanding organizational structure, headcount distribution, spans of control, layers, and workforce costs through interactive charts and visualizations.

## When to Use the Workforce Hub

* Preparing for budget conversations with department leaders and stakeholders
* Identifying opportunities for organizational efficiency improvements
* Analyzing managerial spans and identifying compression or span issues
* Understanding headcount distribution across departments, locations, or pay grades
* Conducting structural analysis to rationalize org design
* Creating data-driven presentations for leadership

## Accessing the Workforce Hub

Open Agentnoon > click **Workforce Hub** in the main navigation. Pre-configured charts load immediately.

<figure><img src="https://2094208261-files.gitbook.io/~/files/v0/b/gitbook-x-prod.appspot.com/o/spaces%2FCZc46qaaBbVmMuYXPfgz%2Fuploads%2FqKmv9TR7zP1msxvKgGg8%2Fimage.png?alt=media&amp;token=1451f58d-d9de-4001-8c81-07fcfa6abd5d" alt=""><figcaption></figcaption></figure>

## Key Features

#### Chart Library

Pre-configured charts ready to provide immediate insights:

* Layers and Spans of Control — analyze managerial structures and identify span issues
* Headcount Distribution — view workforce distribution across various dimensions
* Headcount Heatmap — visualize headcount density across layers and departments
* Org Map — see proportional headcount splits across the organization
* Cost Analysis Charts — understand workforce expenses and budget allocation
* Span of Control Distribution — group managers by span sizes

#### Interactive Controls

Every chart in the Workforce Hub includes:

* Chart selector dropdown — switch between different chart types
* X-axis and Y-axis configuration — customize data dimensions
* Filters — focus on specific departments, locations, or attributes
* Settings gear icon — access chart-specific customization options
* Export options — download as PNG, PowerPoint, or CSV
* Show table function — view raw data behind the visualizations

#### Filter Persistence

Filters applied in the Workforce Hub persist across all views — when switching between charts, navigating back to the org chart, and when creating slide packs.

**Note:** If you're seeing unexpected data, always check your active filters.

## Common Workflows

#### 1. High-Level Analysis Workflow

**High-level analysis** — Start in the Workforce Hub for a bird's-eye view > use aggregate charts like Layers and Spans of Control to identify patterns > apply filters to focus on specific departments > note areas of concern or opportunity.

**Detailed discovery** — Begin with Hub charts to identify potential issues > navigate to the Org Chart > use Spotlight to drill into specific positions > analyze individual manager situations > return to Hub to verify impact of potential changes.

**Presentation** — Configure charts with relevant filters and settings > export individual charts or create a Slide Pack > download as PowerPoint for executive presentations > use CSV exports for detailed data analysis.

### Navigation Tips

* Use the **Go to Hub** button (top-right) to return to the chart library
* Use keyboard shortcuts: Press **1-5** to jump between main sections
* The **show table** function reveals position-level breakdowns
* Click on chart elements for interactive filtering (chart-specific)

### Best Practices

* **Check filters first** — always verify what data is in scope before analysis
* **Use multiple chart types** — different charts reveal different insights
* **Export early and often** — save snapshots of analysis for reference
* **Combine with org chart** — use Hub for high-level analysis, org chart for details
* **Consider context** — numbers alone don't tell the story; understand the business context behind the data

### Available Charts

The Workforce Hub includes the following chart types:

* [Layers and Spans of Control](/hub/layers-spans-chart)
* [Headcount Distribution](/hub/headcount-distribution-chart)
* [Headcount Heatmap](/hub/headcount-heatmap-chart)
* Org Map
* Icicle Chart
* Proportion Chart
* Span of Control Distribution
* Average Span of Control
* Pyramid Chart
* Headcount Cost Chart
* Stacked Headcount Cost Chart

For information about creating packs, see [Slide Packs](/hub/packs).

### Visual Guide

<figure><img src="https://2094208261-files.gitbook.io/~/files/v0/b/gitbook-x-prod.appspot.com/o/spaces%2FCZc46qaaBbVmMuYXPfgz%2Fuploads%2FVkOwHXjsJkT3xIT9r0uL%2Fimage.png?alt=media&amp;token=4f5e6c34-ca1a-4a1f-93b4-dfe139a91911" alt=""><figcaption></figcaption></figure>

<figure><img src="https://2094208261-files.gitbook.io/~/files/v0/b/gitbook-x-prod.appspot.com/o/spaces%2FCZc46qaaBbVmMuYXPfgz%2Fuploads%2FTE473SDVBS9uMURSl6OB%2Fimage.png?alt=media&amp;token=6e216f3d-c8b7-44ff-8b32-edbbb7da2e72" alt=""><figcaption></figcaption></figure>

<figure><img src="https://2094208261-files.gitbook.io/~/files/v0/b/gitbook-x-prod.appspot.com/o/spaces%2FCZc46qaaBbVmMuYXPfgz%2Fuploads%2FYfyy1WtXBWb4wyZIchoL%2Fimage.png?alt=media&amp;token=d8efed74-b975-4ce2-8843-4f13142c64bc" alt=""><figcaption></figcaption></figure>


# Orientation & Navigation

Finding your way around Workforce Hub

## Accessing Workforce Hub

From Main Org or any scenario: click the view dropdown (defaults to "Org Chart") > select **Workforce Hub**.

From a scenario, the Before/After/Changes toggle is available to compare baseline vs. proposed state.

## Available Charts

**Layers & Spans Chart** — Bubble chart of span of control by management layer. Red bubbles = unhealthy spans; size = number of managers. Drill in by clicking a bubble.

**Headcount Distribution Chart** — Proportional view of headcount across any dimension (department, location, job level). Hover for exact numbers; click a segment to filter.

**Headcount Heatmap Chart** — Cross-tabulation of two dimensions with color intensity for concentration. Best for analyzing org depth and coverage gaps.

Switch charts via the chart selector dropdown at the top.

## Configuration Controls

Each chart has:

* **Primary dimension (X-axis):** Department, Location, Country, Job Level, Employee Type, custom attributes
* **Secondary dimension (Y-axis, Heatmap only):** Same options — creates cross-tab
* **Metric:** Headcount count, Cost, Average Salary, or Span of Control
* **Filters:** Department, Location, Job Level, Employee Type, custom fields (AND logic; clear all with one click)

Access advanced settings (sort order, percentages vs. counts, axis reversal) via the gear icon.

## Before / After / Changes (Scenarios Only)

When in a scenario:

* **Show Before** — baseline metrics (current Main Org state)
* **Show After** — proposed state with all scenario changes applied
* **Show Changes** — delta between before and after

Use Show Before to establish baseline, Show After to validate improvements, Show Changes to communicate impact to stakeholders.

## Exporting

Export button (top-right): PNG for presentations, PowerPoint for editable charts, CSV for analysis in Excel or BI tools.

For CSV: click **Show Table** first, then download.

## Common Workflows

**See SOC distribution:** Layers & Spans chart > look for red bubbles > click to drill into specific managers.

**See headcount by department:** Headcount Distribution > set dimension to Department.

**Find leadership coverage gaps:** Headcount Heatmap > X-axis = Department > Y-axis = Job Level > look for empty cells at senior levels.

**Compare org health before/after reorg:** Open scenario > Workforce Hub > select chart > toggle Before → After → Changes.

## Related Articles

* [Layers & Spans Chart](/hub/layers-spans-chart)
* [Headcount Distribution Chart](/hub/headcount-distribution-chart)
* [Headcount Heatmap Chart](/hub/headcount-heatmap-chart)
* [Hub Overview](/hub/overview)


# Slide Packs

Creating, sharing, and exporting insights visually

Create slide packs in the Workforce Hub to compile workforce insights into a structured report, customize slides, and export presentations.

## Creating a Pack

1. Inside the **Workforce Hub**, click **Go to Slide Pack**(top-right).

<figure><img src="https://2094208261-files.gitbook.io/~/files/v0/b/gitbook-x-prod.appspot.com/o/spaces%2FCZc46qaaBbVmMuYXPfgz%2Fuploads%2FLnpWyxOBgJdSekhSuJ3X%2FScreenshot%202026-03-05%20at%202.53.04%E2%80%AFPM.png?alt=media&amp;token=e9d2b36d-b62c-4b4d-9bb0-24a982283c92" alt=""><figcaption></figcaption></figure>

2. From the landing page, choose how to start:
   * **Blank pack** — build from scratch by selecting the charts you want to include
   * **Template** — choose from ready-made packs (e.g., Org Design and Structural Analysis) to set up slides instantly
   * **Existing pack** — search and open a pack you've already created

**If starting with a blank pack:**

1. Select individual charts to include, or click **Select All** to add every available chart
2. Enter a name for the pack
3. Click **Create**

<figure><img src="https://2094208261-files.gitbook.io/~/files/v0/b/gitbook-x-prod.appspot.com/o/spaces%2FCZc46qaaBbVmMuYXPfgz%2Fuploads%2FrIcBrNmwIVNsibwWrRWR%2Fimage.png?alt=media&amp;token=249cbc24-cd96-43a0-a1f8-946eda0cbde9" alt=""><figcaption></figcaption></figure>

## Adding & Customizing Slides

1. Click **+** to add a new slide
2. Select a chart type using the **Select Chart** button
3. Assign a title to each slide for clarity

Filters are saved between sessions — your selections persist automatically.

## Exporting & Sharing the Pack

* Click **Export** to download all slides as a PowerPoint (.pptx) file
* Click **Share** to grant access to others with permission to the scenario or board

<figure><img src="https://2094208261-files.gitbook.io/~/files/v0/b/gitbook-x-prod.appspot.com/o/spaces%2FCZc46qaaBbVmMuYXPfgz%2Fuploads%2FqLLUqp7vFAcyAKoKavLd%2Fimage.png?alt=media&amp;token=62d0fedb-803b-4e67-bdd5-02bb96116015" alt=""><figcaption></figcaption></figure>

## Locking Slides

* Use the **⋮** menu to lock individual slides and prevent others from editing them
* Use **Lock All** / **Unlock All** to control editing access for the entire pack
* Useful when multiple users are collaborating on the same pack

<figure><img src="https://2094208261-files.gitbook.io/~/files/v0/b/gitbook-x-prod.appspot.com/o/spaces%2FCZc46qaaBbVmMuYXPfgz%2Fuploads%2FqrjX0xYV4QnsbVeCASZq%2FScreenshot%202026-03-05%20at%202.58.48%E2%80%AFPM.png?alt=media&amp;token=5365731f-9696-4cd5-b848-29ce9f87afb1" alt=""><figcaption></figcaption></figure>


# Chart Library

Common charts in Agentnoon and how to use them

Agentnoon provides a variety of charts to analyze your organization's structure, spans, layers, and costs.

## High-Level Organizational View Charts

These charts provide a **bird’s-eye view** of the organization:

* **Org Map** — Proportional split of headcount across the organization in one visual
* **Icicle Chart** — Abstract version of the org chart for navigation and summary insights
* **Proportion Chart** — Headcount distribution broken down across different areas of the company

<figure><img src="https://2094208261-files.gitbook.io/~/files/v0/b/gitbook-x-prod.appspot.com/o/spaces%2FCZc46qaaBbVmMuYXPfgz%2Fuploads%2FdAi0psZY3x51uvyBGkw6%2Fimage.png?alt=media&amp;token=5d165913-360d-461c-81fb-0cb71e0f7255" alt=""><figcaption></figcaption></figure>

## Span of Control Charts

Used to **analyze managerial spans**:

* **Span of Control Distribution** — Groups managers by span sizes (e.g., 1:1, 1:3, 3:5)
* **Average Span of Control** — Summary view of average span across departments or entities

<figure><img src="https://2094208261-files.gitbook.io/~/files/v0/b/gitbook-x-prod.appspot.com/o/spaces%2FCZc46qaaBbVmMuYXPfgz%2Fuploads%2Fplo0CrS2Ytg7RLt4nsOd%2Fimage.png?alt=media&amp;token=1c3bd510-76e5-46ce-b963-a29f58670e83" alt=""><figcaption></figcaption></figure>

## Layers & Hierarchy Charts

These charts help visualize **organizational depth and hierarchy**:

* **Headcount Heatmap** — Headcount distribution across levels, with department or entity on the x-axis
* **Layers & Span of Control Chart** — Combines layers and spans; x-axis = span, y-axis = department
* **Pyramid Chart** — Headcount distribution by layer or level; identifies whether the org is top-heavy, bottom-heavy, or balanced

<figure><img src="https://2094208261-files.gitbook.io/~/files/v0/b/gitbook-x-prod.appspot.com/o/spaces%2FCZc46qaaBbVmMuYXPfgz%2Fuploads%2FOLBQizobmbvqjsegq0AG%2Fimage.png?alt=media&amp;token=37e45b58-3e87-4103-8697-3898f9f0e073" alt=""><figcaption></figcaption></figure>

## Cost Analysis Charts

Used to analyze **workforce expenses**:

* **Headcount Cost Chart** — Total cost by team or entity
* **Stacked Headcount Cost Chart** — Total cost broken down into components: salary, benefits, and additional expenses

<figure><img src="https://2094208261-files.gitbook.io/~/files/v0/b/gitbook-x-prod.appspot.com/o/spaces%2FCZc46qaaBbVmMuYXPfgz%2Fuploads%2F7ow3z8OgTSUYYyxwF9ky%2Fimage.png?alt=media&amp;token=a5d4a16e-e538-4b67-966c-6a19413f53ef" alt=""><figcaption></figcaption></figure>


# Layers and Spans of Control Chart

Detailed guide to using the Layers and Spans of Control chart

The Layers and Spans of Control chart is a matrix showing how many managers fall into different span-of-control ranges across layers or departments. It immediately surfaces where spans are too narrow (compression) or too wide (overload).

## What It Shows

* **X-axis (columns)** — Span of control groupings (e.g., 1–2, 3–5, 6–9, 10–15, 16–25)
* **Y-axis (rows)** — Layers, Department, KLT Area, Pay Grade, or Location
* **Cell values** — Count of managers in each combination

**Example:** "In Growth, 114 managers have SOC 1–2, concentrated at layers 5 and 6."

## Configuration

**Span groupings (gear icon)** — Customize ranges to match your needs. Recommended settings: exclude 0–0 (ICs), include 1–2, 3–5, 6–9, 10–15, 16–25, 26–40. Drag to reorder from smallest to largest.

**Y-axis** — Layers (default) for layer-by-layer analysis; Department or KLT Area for cross-functional comparison; Pay Grade for compensation level analysis.

**Filters** — Apply a KLT area or department filter to analyze one org at a time — clearer patterns emerge with a focused scope.

## Interpreting the Data

**High concentrations in 1–2 span columns** — Potential compression — leaders managing minimal teams. Some 1:1 relationships are legitimate (e.g., VP of Strategy under CEO), but many indicate structural inefficiency.

**High spans (16–25+)** — Potential overload — evaluate based on work type, standardization, and manager experience. Not always problematic.

**Layer distribution patterns:**

* Many narrow spans at senior levels (layers 1–3) — top-heavy, senior leadership compression
* Many narrow spans at lower levels (layers 5–6) — compression in the execution layer
* Balanced distribution — healthy structure

## Common Use Cases

**Budget planning** — Configure chart > filter to one KLT area > identify high concentrations in the 1–2 range > note layers of concern > navigate to org chart with Spotlight (Direct SOC = 1–2) to investigate specifics.

**Leadership compression** — Set Y-axis to Pay Grade > focus on senior levels > look for narrow spans at top pay grades > use **Show Table** to see specific positions.

**Cross-department comparison** — Filter to Dept A, note the pattern, screenshot; switch to Dept B and compare — which has more narrow spans? Which structure could inform the other?

## Interactive Features

**Show Table** — Click to see the position-level breakdown behind each cell: exact lists, all attributes, and exportable data.

**Clickable cells** — Click a cell to drill in and filter to that span/layer combination.

## Export

PNG for presentations, PowerPoint for editable charts (recommended for budget decks), CSV (via **Show Table**) for quantitative analysis.

## Troubleshooting

| Problem                         | Solution                                                                                |
| ------------------------------- | --------------------------------------------------------------------------------------- |
| Too many rows (too many layers) | Filter to specific layers or a smaller org scope                                        |
| Numbers seem wrong              | Verify active filters; check if the 0–0 grouping is included (inflates counts with ICs) |
| Can't see narrow spans clearly  | Break down further: 1–1, 2–2, 3–3 groupings for more granularity                        |

## Related Resources

* [Headcount Heatmap Chart](/hub/headcount-heatmap-chart)
* [Headcount Distribution Chart](/hub/headcount-distribution-chart)
* [Hub Overview](/hub/overview)
* [Span of Control Analysis Tutorial](/reference-guides/overview/span-of-control-analysis)


# Headcount Distribution Chart

Guide to using the Headcount Distribution chart

The Headcount Distribution chart shows how your workforce is allocated across any organizational dimension — layers, departments, locations, pay grades, or custom fields.

## Configuration

**X-axis dimension** — Layers (most common), Department, KLT Area, Location, Pay Grade, Job Function, or any custom attribute. Change via the second dropdown in the chart navigation bar.

**Display mode (gear icon)** — Toggle between Counts (absolute headcount) and Percentages (relative proportions). Use percentages to compare across differently-sized organizations; use counts for budget planning.

**Sort order (gear icon)** — Ascending, Descending, or Natural order (Layer 1, 2, 3... or alphabetical). Use Natural order for hierarchical data; Descending to rank by size.

## Interpreting Layer Distributions

* **Pyramid (bottom-heavy):** More people at lower layers — common in operations-heavy orgs; generally healthy
* **Inverted pyramid (top-heavy):** More people at senior layers — may indicate excess management or compression
* **Diamond (balanced):** Concentration in middle layers — common in knowledge work

## Interpreting Department/Location Distributions

Shows relative team sizes side-by-side. Quickly identify the largest and smallest teams, geographic concentration, and unexpected imbalances.

## Use Cases

**Org structure analysis** — Layers × Percentage × Natural sort to see org shape for leadership review.

**Department comparison** — Department/KLT Area × Numbers × Descending to rank team sizes for resource allocation.

**Geographic distribution** — Work Country or City × Percentage to analyze location concentration.

**Pay grade distribution** — Pay Grade × Percentage × Natural sort to identify compression or skewed compensation levels.

## Interactive Features

**Show Table** — Click to reveal position-level breakdown for any dimension: exact lists, all attributes, exportable.

**Chart filtering** — Click a bar to drill into that subset (chart-specific).

## Export

PNG for presentations, PowerPoint for editable charts (recommended), CSV (via Show Table) for Excel analysis.

## Troubleshooting

| Problem                | Solution                                                                |
| ---------------------- | ----------------------------------------------------------------------- |
| Chart looks unexpected | Check active filters; verify dimension selection                        |
| Numbers don't match    | Review filters; check access scope; verify effective dates in scenarios |
| Missing dimensions     | Check Data Management > Fields and Attributes; may not be configured    |

## Related Resources

* [Headcount Heatmap Chart](/hub/headcount-heatmap-chart)
* [Layers and Spans of Control Chart](/hub/layers-spans-chart)
* [Hub Overview](/hub/overview)


# Headcount Heatmap Chart

Guide to using the Headcount Heatmap chart

The Headcount Heatmap shows workforce distribution across two dimensions simultaneously — revealing structural depth and patterns that are invisible in single-dimension views.

## What It Shows

* **X-axis (columns):** Primary grouping — Department, KLT Area, Location, Job Function
* **Y-axis (rows):** Hierarchical dimension — Layers (most useful), Pay Grade, Level
* **Cell color intensity:** Darker = more headcount in that intersection
* **Cell values:** Exact headcount numbers

**Recommended setup:** X-axis = Department (or KLT Area), Y-axis = Layers.

## How to Read It

**Layer depth** — Count how many rows have data per column — this is how many layers that department has. Consistent depth across departments indicates standardized structure; outlier columns indicate structural variation.

**Concentration points** — Dense cells show where most people are. Small populations at high layers (e.g., 2 people in Layer 9) are potential efficiency flags — are those senior positions adding value?

**Structural anomalies to flag:**

* One department with 9+ layers when others have 6 — why so many?
* Very small populations (1–3 people) at high layer numbers
* Missing middle layers (structural gaps)
* Highly inconsistent patterns across comparable departments

**Healthy patterns** — 5–6 consistent layers across departments, concentration in middle layers (3–5), minimal populations at extreme layers.

## Common Use Cases

**Analyze chain length:** Set Departments × Layers, count rows per column, identify which departments have unusually long reporting chains, investigate why.

**Compare business units:** Look for departments with different patterns from peers; consistent patterns = standardized structure; variation warrants investigation.

**Pre/post-reorg comparison:** View heatmap in Main Org (current state), screenshot, then open the scenario to see how proposed changes reduce layers or redistribute headcount.

## Interactive Features

**Show table** — Click to reveal position-level breakdown for any cell (who is in that layer-department combination). Also exportable.

**Filters** — Apply filters to focus on specific layers only (e.g., Layers 1–4 for leadership analysis) or specific departments.

**Export** — PNG for presentations, PowerPoint for editable charts, CSV for quantitative analysis in Excel.

## Troubleshooting

| Problem                          | Solution                                                                                  |
| -------------------------------- | ----------------------------------------------------------------------------------------- |
| Chart looks empty                | Check filters; verify X/Y axes are configured; confirm recent data upload                 |
| Too many layers showing          | May be legitimate or a data issue; filter to Layers 1–6 to reduce noise                   |
| Numbers don't match expectations | Check scope filters; verify access permissions; confirm effective date range in scenarios |

## Related Resources

* [Layers and Spans of Control Chart](/hub/layers-spans-chart)
* [Headcount Distribution Chart](/hub/headcount-distribution-chart)
* [Hub Overview](/hub/overview)
* [Planning a Reorganization](/reference-guides/overview/planning-reorganization)


# Forecast Overview

Introduction to Forecast and headcount planning

Forecast is Agentnoon's pivot table-style visualization tool for analyzing headcount and workforce costs over time. It provides flexible ways to view and aggregate data from your Main Org or Scenarios — by department, location, time period, and more.

**Key principle** — Forecast shows you what's already in your data. To model changes (adding positions, closing roles, moving people), use Scenarios. To see those changes projected over time, use Forecast.

## Accessing Forecast

From Main Org or any scenario: click the module dropdown at the top > select **Forecast**.

<figure><img src="https://2094208261-files.gitbook.io/~/files/v0/b/gitbook-x-prod.appspot.com/o/spaces%2FCZc46qaaBbVmMuYXPfgz%2Fuploads%2FcIRj1yLuTJMBkAtGe6MS%2Fimage.png?alt=media&amp;token=11e6b993-31df-4546-afb0-211786252d25" alt=""><figcaption></figcaption></figure>

## How Forecast Works

Forecast functions like a pivot table with three key components:

**Row Aggregator** — Defines each row. Choose how to group your data:

* People — one row per person
* Department — one row per department
* Location — one row per location/country
* Employee Type — one row per employee type
* Any custom field — group by pay grade, business unit, etc.

**Columns** — What appears across the top:

* Time periods: Monthly, Quarterly, or Yearly
* Monetary fields: Salary, bonuses, allowances, or other compensation components
* Multiple pay components can be shown simultaneously (e.g., salary + bonus)

**Values** — What's measured. Toggle between:

* Headcount — number of positions/employees
* Cost — workforce cost (salary and configured compensation)

## Understanding Forecast Data

**Headcount view:**

* Current headcount reflects positions that exist today
* Future headcount appears based on hire dates in your data
* If a position has a hire date in Q3, that headcount appears starting in Q3
* Headcount doesn't divide by 12 — a position in 2026 persists into 2027 unless it has a termination date

**Example:** You have 100 employees today and 10 positions with hire dates in Q2 2026. Forecast will show:

* Q1 2026: 100 headcount
* Q2 2026: 110 headcount (10 new hires added)
* Q3 2026: 110 headcount (no terminations, headcount persists)

**Cost view:**

* Annual salaries are what's stored in Agentnoon
* Monthly view divides annual salary by 12
* Quarterly view shows salary for that quarter
* Yearly view shows full annual cost
* Cost increases when positions with hire dates become active

**Note:** Agentnoon supports annualizable compensation. One-time payments (signing bonuses, spot bonuses) are not currently supported in Forecast.

## Key Forecast Capabilities

**Flexible aggregation** — View your workforce from any angle:

* Aggregate by department to see total departmental costs
* Aggregate by location to understand geographic distribution
* Aggregate by employee type to distinguish contractors vs. full-time

**Time-based analysis:**

* **Monthly** — Precise month-by-month projections; annual cost divided by 12
* **Quarterly** — Standard for budget planning and board reporting
* **Yearly** — Best for annual budget planning; shows full annual cost per year; up to 5 years

<figure><img src="https://2094208261-files.gitbook.io/~/files/v0/b/gitbook-x-prod.appspot.com/o/spaces%2FCZc46qaaBbVmMuYXPfgz%2Fuploads%2FEXRwhgFBp3PBUah4G7xV%2FScreenshot%202026-03-05%20at%203.08.11%E2%80%AFPM.png?alt=media&amp;token=b857631c-513a-4865-877d-9465a8ad237e" alt=""><figcaption></figcaption></figure>

**Before / After / Changes (scenarios only):**

* **Show Before** — Main Org baseline (current state)
* **Show After** — Scenario final state
* **Show Changes** — Delta between before and after

<figure><img src="https://2094208261-files.gitbook.io/~/files/v0/b/gitbook-x-prod.appspot.com/o/spaces%2FCZc46qaaBbVmMuYXPfgz%2Fuploads%2FJU2vgdAr2qWMIT0CZIGy%2FScreenshot%202026-03-05%20at%203.09.32%E2%80%AFPM.png?alt=media&amp;token=60f49fff-67d3-41d3-ab49-42277ab21f97" alt=""><figcaption></figcaption></figure>

**Example:** You move 5 people from Network Ops to Operations & Logistics:

* After view — shows all 5 people in Operations & Logistics
* Changes view — shows -5 in Network Ops, +5 in Operations & Logistics

**Note:** "Show Before" always references your Main Org, not the starting state of a scenario or any other scenario.

**Filtering and search** — Apply filters and search for specific positions or employees. Filters apply globally across Directory, Forecast, and Workforce Hub.

**Export** — Download forecast data to CSV for further analysis in Excel or presentations.

## Forecast Limitations

| Forecast is NOT for                                  | Use this instead |
| ---------------------------------------------------- | ---------------- |
| Data input — you can't add positions or make changes | Scenarios        |
| Budget targets or goals                              | Coming soon      |
| Approval workflows                                   | Scenarios        |
| Tracking actuals vs. budget variance over time       | Your FP\&A tool  |

## Common Use Cases

**Quarterly headcount planning** — Aggregate by Department > view Quarterly > Headcount > see headcount growth projections based on hire dates.

**Annual budget planning** — Aggregate by Department or Cost Center > view Yearly > switch to Cost > see total annual workforce cost by department.

**Multi-year strategic planning** — Create a scenario with phased hiring (hire dates in 2026, 2027, 2028) > view Yearly in Forecast > see headcount and cost ramp over 3 years > aggregate by Department to see where growth is concentrated.

**RIF or budget cut impact** — Create a scenario closing positions with effective dates > view Monthly or Quarterly > see exactly when cost reductions take effect > aggregate by Department to show department-specific impact.

## Forecast and Effective Dates

Beyond hire and termination dates, you can use effective dates to model changes over time.

1. In a scenario, make a change (move someone to a new department, change their salary)
2. Assign an effective date to that change (e.g., January 2027)
3. In Forecast, that change appears starting in the effective date period

**Example:** 5 people currently in Network Operations are planned to move to Operations & Logistics in 2027. Change their department field and set effective date to January 2027. In Forecast, they appear in Network Ops through 2026, then shift to Operations & Logistics from January 2027.

**Alternative approach for headcount tracking:**

* Close 5 positions in Network Ops (with effective date)
* Add 5 positions in Operations & Logistics (with hire date)
* This shows a clear -5 / +5 split in Changes view

## Getting Started with Forecast

**Step 1: Understand your current state**

* Go to Main Org > **Forecast**
* Aggregate by Department > view Yearly
* This shows your current workforce cost by department

**Step 2: Model future changes in a scenario**

* Create a new scenario
* Add positions with hire dates for future quarters
* Close positions with termination dates if modeling attrition
* Assign effective dates to changes you want phased over time

**Step 3: View your scenario in Forecast**

* Open your scenario > switch to **Forecast**
* Toggle between Before, After, and Changes
* Adjust time granularity (Monthly, Quarterly, Yearly)
* Aggregate by the dimension that matters (Department, Location, etc.)

**Step 4: Export and share**

* Export to CSV
* Share projections with Finance, HR leadership, or executives
* Use exported data in presentations or budget planning tools

## Next Steps

* [Forecast Navigation](/forecast/navigation) - Master the Forecast interface and controls
* [Building Headcount Forecasts](/forecast/building-headcount-forecasts) - Create your first forecast
* [Multi-Year Planning](/forecast/multi-year-planning) - Long-term workforce projections


# Orientation & Navigation

Navigating the Forecast interface and tools

<figure><img src="https://2094208261-files.gitbook.io/~/files/v0/b/gitbook-x-prod.appspot.com/o/spaces%2FCZc46qaaBbVmMuYXPfgz%2Fuploads%2F4jRBuxXieoHKH389pRnR%2Fimage.png?alt=media&amp;token=c26ab799-40ef-41f8-847f-1ddced81a41a" alt=""><figcaption></figcaption></figure>

## Accessing Forecast

From Main Org or any scenario: click the module dropdown at the top > select **Forecast**. Configuration (aggregator, time period, etc.) is retained when you switch between contexts.

## Interface Layout

**Top bar (left to right):**

* **Row Aggregator dropdown** — How to group data (Department, Location, Employee Type, Pay Grade, custom fields, or People for individual rows)
* **Headcount/Cost toggle** — Switch metric
* **Monetary Fields** — Add Bonus, Stock, Allowances alongside Salary
* **Filter button** — Narrow to a subset
* **Search button** — Find specific positions or employees
* **Time Period dropdown** — Monthly, Quarterly, or Yearly
* **Year selector** — Which year to display (Monthly/Quarterly only)
* **Export button** — CSV download

**Forecast table** — Rows = aggregator groups, Columns = time periods, Values = headcount or cost.

## Key Controls

**Row Aggregator** — Department for budget planning, Location for geographic analysis, Pay Grade for compensation analysis, People for individual review, any custom field for business unit or cost center views.

**Headcount vs. Cost** — Headcount = count of positions per period (a 2026 hire persists into 2027 unless terminated). Cost = salary ÷ 12 per month, ÷ 4 per quarter, full year for yearly view.

**Time periods:**

* **Monthly** — Precise timing for when hires start or changes take effect; annual salary divided by 12
* **Quarterly** — Standard for budget planning and board reporting
* **Yearly** — Shows up to 5 years; annual cost per year; best for multi-year strategic planning

**Before / After / Changes (scenarios only):**

* **Show Before** — Main Org baseline
* **Show After** — Scenario final state
* **Show Changes** — Delta between before and after (+/- per row)

## Common Navigation Workflows

**Quarterly budget review** — Aggregator = Department > Quarterly > Cost > Salary + Bonus > Export CSV.

**Hiring plan tracking** — Aggregator = Department > Monthly > Headcount > Show Changes (in scenario) > see which months headcount grows.

**Multi-year planning** — Aggregator = Department > Yearly (see all 5 years) > Cost > Export for executive presentation.

**Geographic cost analysis** — Aggregator = Location or Country > Yearly > Cost.

## Troubleshooting

<table><thead><tr><th width="324.609375">Problem</th><th>Solution</th></tr></thead><tbody><tr><td>Future months show zero headcount</td><td>Positions need hire dates to appear in future periods</td></tr><tr><td>Costs don't match expectations</td><td>Check monthly ÷ 12; verify all monetary fields are selected</td></tr><tr><td>Filters not working</td><td>Check if existing filters are active; clear all and start fresh</td></tr><tr><td>Before/After/Changes options missing</td><td>Only available in scenarios, not Main Org</td></tr><tr><td>Export missing data</td><td>Check active filters; verify correct time period is selected</td></tr></tbody></table>

## Related Resources

* [Forecast Overview](/forecast/overview)
* [Building Headcount Forecasts](/forecast/building-headcount-forecasts)
* [Forecast Reports & Exports](/forecast/overview)


# Building Headcount Forecasts

Creating and managing headcount forecasts

## Building Headcount Forecasts

Building a headcount forecast means creating a Scenario with planned changes, then viewing that Scenario in Forecast mode to see projections over time.

**Key principle** — Forecasts are views of your data, not separate documents. You build forecasts by creating Scenarios with planned changes, using hire and effective dates to phase changes over time, then viewing those Scenarios in Forecast mode.

**What you need:**

* A Scenario (or use Main Org for a current state forecast)
* Positions with hire dates for future headcount
* Termination dates if modeling attrition
* Effective dates for phased organizational changes

### Method 1: Forecast Current State

**Use for:** Reporting current workforce size and cost — no scenario needed.

1. Go to Main Org > **Forecast**
2. Aggregator: choose Department, Location, or desired dimension
3. Toggle: Headcount
4. Time period: Yearly, Quarterly, or Monthly
5. Export or analyze

**What you'll see:** Current headcount distributed across your chosen aggregation, projected forward. Headcount persists unless termination dates exist.

### Method 2: Forecast with Hire Dates (Phased Hiring Plan)

**Use for:** Planning staggered hiring across quarters.

**Step 1: Create a scenario**

1. Click **Create Scenario**
2. Name it descriptively (e.g., "2026 Engineering Hiring Plan")
3. Select scenario type (usually Full Org)
4. Click **Create**

**Step 2: Add positions with hire dates**

1. Navigate to the department where you'll add positions
2. Click **+ Add Position** or use bulk add
3. Fill in position details: Title, Department, Manager, Salary
4. Set the Hire Date — this is required for the position to appear in Forecast

Set hire dates based on your hiring timeline:

* Q1 hires: January, February, or March
* Q2 hires: April, May, or June
* Q3 hires: July, August, or September
* Q4 hires: October, November, or December

**Example:**

* 3 Software Engineers — hire date: March 15, 2026
* 2 Product Managers — hire date: June 1, 2026
* 5 Sales Reps — hire date: September 1, 2026

**Step 3: View in Forecast**

1. Stay in your scenario > click **Forecast**
2. Aggregator: Department
3. Toggle: Headcount
4. Time period: Quarterly, Year: 2026
5. View: Show After

**What you'll see:**

* Q1 2026: Current headcount + 3 (March hires)
* Q2 2026: Previous + 2 (June hires)
* Q3 2026: Previous + 5 (September hires)
* Q4 2026: Same as Q3 (no new hires)

**Step 4: Analyze cost impact**

1. Toggle to Cost
2. Monetary fields: select Salary (or add Bonus, etc.)

**What you'll see:** Total salary cost increases as new hires join.

### Method 3: Forecast with Effective Dates (Organizational Changes Over Time)

**Use for:** Modeling a reorganization or departmental transfer happening in the future.

**Step 1: Make organizational changes**

1. In a scenario, select positions to move (e.g., 5 people from Network Ops to Operations & Logistics)
2. Change their department field to the new department
3. Assign an effective date to all changes (e.g., January 1, 2027)

**Step 2: View in Forecast**

1. Click **Forecast** > Aggregator: Department
2. Toggle: Headcount or Cost
3. Time period: Quarterly or Yearly; select years spanning the effective date

**What you'll see:**

* Through Q4 2026: People remain in Network Ops
* Starting Q1 2027: People appear in Operations & Logistics
* Show Changes view: -5 Network Ops, +5 Operations & Logistics starting Q1 2027

### Method 4: Model Attrition with Termination Dates

**Use for:** Planning for expected attrition or retirements.

**Step 1: Identify positions closing**

1. In a scenario, find positions closing due to retirement, planned departures, or budget cuts
2. Close those positions and assign termination dates

**Step 2: View in Forecast**

1. Forecast > Aggregator: Department
2. Toggle: Headcount > Time period: Quarterly
3. View: Show Changes

**What you'll see:**

* Negative headcount changes (-1, -2, etc.) in quarters when positions close
* Workforce cost decreases accordingly

### Method 5: Combined Hiring and Attrition Forecast

**Use for:** Modeling realistic workforce dynamics with both hiring and departures.

1. Add new positions with future hire dates (net growth)
2. Close positions with termination dates (model turnover or planned departures)
3. Forecast > Show Changes > Aggregator: Department > Quarterly

**Example:**

* Q1: +10 hires, -3 departures = +7 net headcount
* Q2: +5 hires, -2 departures = +3 net headcount
* Q3: +8 hires, -4 departures = +4 net headcount
* Q4: +2 hires, -1 departure = +1 net headcount
* Annual net growth: +15 headcount

### Multi-Department Hiring Plan

**Use for:** Coordinating hiring across multiple departments.

**Step 1: Add positions by department**

* Engineering: 15 positions across Q1–Q4
* Sales: 10 positions in Q2–Q3
* Marketing: 5 positions in Q1
* Product: 8 positions across all quarters

**Step 2: Stagger hire dates** — Spread hires throughout the quarter. Don't cluster everyone on quarter start dates; factor in ramp-up time.

**Step 3: Analyze aggregated impact**

1. Forecast > Show After > Aggregator: Department
2. Toggle: Headcount > Time period: Quarterly
3. Review hiring ramp by department

**Step 4: Check budget impact**

1. Toggle to Cost
2. Verify total salary increase by quarter aligns with budget approvals

## Best Practices

* **Use realistic hire dates** — Don't cluster all hires on Jan 1, Apr 1, Jul 1, Oct 1. Spread hires throughout quarters and factor in recruiting timelines.
* **Plan for ramp time** — Stagger starts to avoid overwhelming managers; budget for overlapping periods when backfilling departing employees.
* **Model attrition realistically** — Use historical attrition rates, known retirements, and seasonal fluctuations.
* **Coordinate with budget cycles** — Align hire dates with budget availability and quarterly releases.
* **Use effective dates for non-hire changes** — Promotions, department transfers, and salary adjustments planned for future dates.
* **Keep scenarios organized** — Name clearly (e.g., "2026 Q2–Q4 Hiring Plan"), add descriptions explaining assumptions, and tag by purpose.

## Exporting and Sharing Your Forecast

1. Configure the view: set aggregator, time period, headcount/cost toggle, and any filters
2. Click **Export** > **CSV**
3. Share with stakeholders:
   * **Finance** — Department aggregation, Cost view, Quarterly
   * **HR** — Department aggregation, Headcount view, Monthly
   * **Executives** — High-level aggregation, Yearly, both Headcount and Cost
4. Use **Show Changes** view to highlight net impact and tie to strategic priorities

## Troubleshooting

| Issue                                                       | Solution                                                                                                                                        |
| ----------------------------------------------------------- | ----------------------------------------------------------------------------------------------------------------------------------------------- |
| Added 10 positions but Forecast only shows +5               | Check hire dates — positions only appear in the period their hire date falls in                                                                 |
| Forecast shows headcount growth but budget didn't increase  | Adding positions without closing others increases net headcount and cost — close equivalent positions or adjust salaries to stay budget-neutral |
| Can't see quarterly progression, only annual totals         | Change Time Period from "Yearly" to "Quarterly", then select the year                                                                           |
| Hiring plan looks lumpy with big spikes in certain quarters | Spread hire dates more evenly — instead of 20 hires on July 1, stagger: 7 in July, 7 in August, 6 in September                                  |
| Need to forecast for 2+ years but only see one year         | Switch Time Period to "Yearly" to see columns for all 5 years                                                                                   |

## Next Steps

* [Forecast Reports & Exports](/forecast/overview#how-forecast-works) - Advanced reporting techniques
* [Multi-Year Planning](/forecast/multi-year-planning) - Long-term strategic workforce planning
* [Time-Based Planning](/scenarios/time-based-planning) - More on effective dates and phasing


# Multi-Year Planning

Long-term headcount and budget planning

Project workforce headcount and costs up to 5 years into the future using Agentnoon's Forecast module.

## Setting Up a Multi-Year Scenario

Create a scenario and add positions with hire dates spread across future years:

1. Name descriptively: "2026-2028 Growth Plan"
2. Add Year 1 positions with hire dates in 2026
3. Add Year 2 positions with hire dates in 2027
4. Add Year 3 positions with hire dates in 2028

**Example:** Adding 50 positions in 2026, 75 in 2027, and 100 in 2028 produces phased growth from 200 → 250 → 325 → 425 employees.

## Viewing in Forecast

1. Open your scenario > switch to **Forecast** view
2. Set Time Period = **Yearly**, Aggregator = Department
3. Toggle between **Headcount** (growth trajectory) and **Cost** (budget implications)

The table shows 5 columns (up to 5 years forward). Positions appear in the year their hire date falls.

## Handling Uncertainty

Create 3 scenarios with different growth assumptions (Conservative: 10%/year, Moderate: 20%/year, Aggressive: 35%/year) and compare in Forecast. Export to CSV to place side-by-side for leadership.

Use ranges when presenting, not exact numbers: "We expect 300–350 employees in 2028" rather than "We'll have 347 employees."

**Plan in phases:**

* **Year 1 (2026):** High detail — specific positions, titles, salaries, hire dates
* **Year 2 (2027):** Moderate detail — position counts by department, budget ranges
* **Year 3+ (2028+):** Directional — headcount targets, rough estimates, acknowledged as preliminary

## Modeling Salary Inflation

Salaries increase over time due to COLA, raises, and promotions. To model this:

1. Use effective dates to apply salary increases in future years (e.g., +3% on Jan 1, 2027)
2. Forecast shows cost increasing even without new hires

Note: Agentnoon does not auto-calculate annual raises — salary updates require manual edits or bulk operations.

## Geographic Cost Planning

Use location-specific rate cards to accurately reflect cost differences (e.g., US engineer at $150K vs. India engineer at $50K). Aggregate Forecast by Location to compare cost efficiency across geographies.

## Rolling Forecasts

Update your multi-year plan quarterly rather than annually:

1. Refresh Main Org with actual hire data
2. Create a new scenario version (e.g., "2026-2028 Plan - Q2 2026 Update")
3. Adjust future hire dates based on actual hiring pace
4. Re-export and share updated projections

Name versions with dates to track changes over time.

## Related Resources

* [Forecast Overview](/forecast/overview)
* [Building Headcount Forecasts](/forecast/building-headcount-forecasts)


# Activity Analysis

Understanding how time is spent in your organization for each activity

Activity Analysis lets you map business activities, allocate effort across positions, and analyze how time is spent across your organization.

## Accessing Activity Analysis

Navigate to your scenario > click the org chart icon next to it > select **Activity Analysis**.

<figure><img src="https://2094208261-files.gitbook.io/~/files/v0/b/gitbook-x-prod.appspot.com/o/spaces%2FCZc46qaaBbVmMuYXPfgz%2Fuploads%2FRFN3lj2XaVK2kLTAu07P%2Fimage.png?alt=media&amp;token=f399968d-74fd-442a-9552-05061d045404" alt=""><figcaption></figcaption></figure>

## Mapping Business Processes and Activities

1. Hover over the root node and click **+** to add Level 1 business processes (e.g., Sales, Finance, Product)

<figure><img src="https://2094208261-files.gitbook.io/~/files/v0/b/gitbook-x-prod.appspot.com/o/spaces%2FCZc46qaaBbVmMuYXPfgz%2Fuploads%2FbpThG2GV08mNf7YpKCkk%2Fimage.png?alt=media&amp;token=86af58c6-a0e8-45bc-bca3-312abb2beeb0" alt=""><figcaption></figcaption></figure>

2. Hover over a business process and click **+** to add activities beneath it (e.g., Offline Sales and Conferences under Sales)

<figure><img src="https://2094208261-files.gitbook.io/~/files/v0/b/gitbook-x-prod.appspot.com/o/spaces%2FCZc46qaaBbVmMuYXPfgz%2Fuploads%2FtcTo97z9QEOZIkohPze5%2Fimage.png?alt=media&amp;token=34f6d73f-204a-4008-934f-8d9a654f5d54" alt=""><figcaption></figcaption></figure>

<figure><img src="https://2094208261-files.gitbook.io/~/files/v0/b/gitbook-x-prod.appspot.com/o/spaces%2FCZc46qaaBbVmMuYXPfgz%2Fuploads%2FdRmWvMDRsH8OC3Htv5Wi%2Fimage.png?alt=media&amp;token=93b08e17-62d0-4eb3-a9ef-09f89b4cd0b6" alt=""><figcaption></figcaption></figure>

## Assigning Roles and Effort

1. Hover over an activity and click the **Positions** icon to assign positions to it
2. Set a time percentage allocation for each position

<figure><img src="https://2094208261-files.gitbook.io/~/files/v0/b/gitbook-x-prod.appspot.com/o/spaces%2FCZc46qaaBbVmMuYXPfgz%2Fuploads%2Fcv0IUdJrBj9v9QdVzZEN%2Fimage.png?alt=media&amp;token=75b690a1-e157-42a9-b7d5-f39e76a89b1b" alt=""><figcaption></figcaption></figure>

3. Confirm allocations to track effort distribution

## Categorizing Activities

Click on an activity box to assign it a category indicating its business impact:

* **Value Add** — Directly contributes to business goals
* **Non-Value Add** — Not directly beneficial but still requires effort

<figure><img src="https://2094208261-files.gitbook.io/~/files/v0/b/gitbook-x-prod.appspot.com/o/spaces%2FCZc46qaaBbVmMuYXPfgz%2Fuploads%2FAY0yHCA9lA4UEDdfJSiz%2Fimage.png?alt=media&amp;token=aca6a62b-e5b4-4681-80ac-f2ff0a1696dd" alt=""><figcaption></figcaption></figure>

## Navigating Activity Maps

1. Use the left-hand panel to move between activities and expand activity trees

<figure><img src="https://2094208261-files.gitbook.io/~/files/v0/b/gitbook-x-prod.appspot.com/o/spaces%2FCZc46qaaBbVmMuYXPfgz%2Fuploads%2FLoRIE3kEiir2kAVLIsvp%2FScreenshot%202026-03-05%20at%202.43.27%E2%80%AFPM.png?alt=media&amp;token=87614a66-745c-4a11-8bfd-c9a07031756c" alt=""><figcaption></figcaption></figure>

2. Click on any activity to drill down further or edit details.

## Analyzing Activity Effort Split by Category

1. Open **Workforce Hub** and navigate to the **Activity Split by Category** chart to visualize your operating model by category. Analyze data through three perspectives:

<figure><img src="https://2094208261-files.gitbook.io/~/files/v0/b/gitbook-x-prod.appspot.com/o/spaces%2FCZc46qaaBbVmMuYXPfgz%2Fuploads%2Fg7FVw6igg5iEKeJuhPMm%2FScreenshot%202026-03-05%20at%202.44.42%E2%80%AFPM.png?alt=media&amp;token=058cca28-da62-440d-a7b9-6c872125ea1a" alt=""><figcaption></figcaption></figure>

2. Analyze data through different perspectives:

* **Effort Split by Activity Level** — Use the filter dropdown to select the activity levels you want to visualize

  <div align="left"><figure><img src="https://19874675.fs1.hubspotusercontent-na1.net/hubfs/19874675/Screenshot%202024-05-27%20at%2010-56-14%E2%80%AFPM-png.png" alt=""><figcaption></figcaption></figure></div>
* **FTE Count or Cost** — Assess effort based on full-time equivalent allocation or salary cost. Hover over bars to see FTE count or cost details for each activity.

<div align="center"><img src="https://19874675.fs1.hubspotusercontent-na1.net/hubfs/19874675/Screenshot%202024-05-27%20at%2010.52.25%20PM.png" alt="Screenshot 2024-05-27 at 10.52.25 PM"></div>

![Screenshot 2024-05-27 at 10.52.17 PM](https://19874675.fs1.hubspotusercontent-na1.net/hubfs/19874675/Screenshot%202024-05-27%20at%2010.52.17%20PM.png)

* **Percentage Distribution** — Visualize workload distribution across functions as Absolute, Total %, or Group %

<figure><img src="https://2094208261-files.gitbook.io/~/files/v0/b/gitbook-x-prod.appspot.com/o/spaces%2FCZc46qaaBbVmMuYXPfgz%2Fuploads%2Fgit-blob-9b65eb3e4f71db65f5bb3e67168bfc3e3007d051%2Fimage%20(5).png?alt=media" alt=""><figcaption></figcaption></figure>


# Admin Overview

Administrative capabilities and configuration overview

Admins in Agentnoon have elevated permissions to configure the platform, manage users, and maintain data integrity. This guide covers everything admins need to know to effectively manage their Agentnoon instance.

## What is an Admin?

**Admins** are power users with special permissions to configure and maintain Agentnoon for their organization. Unlike regular users who primarily view data and create scenarios, admins control the underlying system configuration.

**Who becomes an admin:**

* Initial admins are set up during customer onboarding
* Existing admins can grant admin privileges to other users
* Agentnoon (as the vendor) has super-admin access for support purposes

## Admin vs Regular User Permissions

### What Regular Users Can Do:

* View Main Org
* Create and edit scenarios (with appropriate permissions)
* View Workforce Hub analytics
* Use Forecast to analyze data
* Export data they have access to
* Submit scenarios for approval

### What Only Admins Can Do:

* **User management:** Invite users, manage permissions, configure access groups
* **Data management:** Upload CSV files, configure live integrations, manage data refreshes
* **Field configuration:** Create custom fields, configure formulas, define metrics
* **System settings:** Configure approval workflows, set default views, customize colors
* **Rate card management:** Upload and configure compensation rate cards
* **Auto mapping:** Configure automatic field population rules
* **Access control:** Define who can see what data based on field values

## Core Admin Responsibilities

### 1. User Management & Access Control

**Managing users:**

* Invite new users via email
* Assign admin privileges to power users
* Deactivate users who leave the organization
* Reset passwords if needed

**Access control:**

* Create access groups to limit data visibility
* Configure field-level permissions (who can see/edit which fields)
* Set department or location-based access restrictions
* Define which users can create scenarios vs. view-only access

**Example:** Create an "HRBP North America" access group that only sees US and Canada employees.

### 2. Data Upload & Management

**CSV uploads:**

* Upload full org data files (replaces Main Org)
* Upload partial data (updates specific fields)
* Validate data before upload
* Troubleshoot data errors

**Live integrations:**

* Configure SFTP, Workday, or API integrations
* Set sync frequency
* Monitor integration health
* Handle sync failures

**Data transformation hub:**

* Upload additional CSV files to enrich main data
* Perform joins between data sources
* Download merged data for upload

### 3. Field & Attribute Configuration

**Managing fields:**

* Mark fields as employee fields vs position fields
* Set fields as mandatory for new positions
* Configure field visibility (hide sensitive fields)
* Enable auto-duplication for scenario copying
* Create field groups for organized editing panels

**Creating custom fields:**

* Add new attributes to track (e.g., "Criticality", "Succession Ready")
* Define field types (text, number, dropdown, date)
* Set dropdown values if applicable

**Formulas:**

* Create calculated fields based on other fields
* Examples: Fully loaded cost, Pay ratio, Custom org levels

### 4. Rate Card Configuration

**What rate cards do:**

* Auto-populate salaries when creating new positions
* Based on criteria like pay grade, job family, location
* Ensure consistent, market-aligned compensation

**Setup:**

* Upload rate card CSV file
* Map columns to Agentnoon fields
* Select compensation-determining columns (checkboxes)
* Choose which column maps to salary (or other comp fields)

**Important:** All rate card columns must exist as fields in Agentnoon first.

### 5. Metrics Configuration

**System-calculated metrics:**

* Span of Control (SOC)
* Manager cost ratio
* IC count and cost
* Total org size
* Average manager salary

**Customizing metrics:**

* Disable metrics you don't want visible
* Create custom metrics (e.g., SOC excluding seasonal workers)
* Define calculation rules

### 6. Approval Workflow Configuration

**Setting up approvals:**

* Define Level 1 approvers (first approval stage)
* Define Level 2 approvers (second approval stage)
* Enable "Lock scenarios upon submission" to prevent edits during approval
* Multiple Level 1 approvers possible (any one can approve)
* Level 0 and Level 3 approvers are scenario-specific (set per scenario)

**Approval flow:** Level 0 (scenario-specific) → Level 1 (global) → Level 2 (global) → Level 3 (scenario-specific)

### 7. Other Admin Settings

**Colors:**

* Customize highlight colors for departments, locations, etc.
* Ensure colors align with company branding

**Default views:**

* Save views (filters + highlights + card content) as defaults
* Assign default views to specific users or scenarios
* Helps onboard new users with pre-configured views

**Organization roots:**

* Typically one CEO as root
* Configure multiple roots if needed (e.g., multiple business units)

**General settings:**

* SSO configuration
* Data sync preferences
* UI customization options

## Ongoing Admin Maintenance

### Weekly Tasks

* Monitor data sync status (if using live integration)
* Review user access requests
* Address data error reports from users

### Monthly Tasks

* Review active users and deactivate former employees
* Update rate cards if compensation bands change
* Audit access groups for accuracy
* Check for new feature releases from Agentnoon

### Quarterly Tasks

* Refresh training for new users
* Review and optimize access control rules
* Update custom fields as business needs evolve
* Conduct admin best practices review

### Annual Tasks

* Major data cleanup (archive old scenarios, remove outdated fields)
* Comprehensive access audit
* Review and update approval workflows
* Renew or expand Agentnoon licenses

## Common Admin Workflows

### Onboarding a New User

1. Go to Settings → Users (or Access Control section)
2. Click "Invite User"
3. Enter email address
4. Assign access group (determines what data they see)
5. Set permissions (Viewer, Planner, Approver)
6. Send invitation
7. User receives email to set up account

### Uploading New Data

1. Export latest data from HRIS
2. Format CSV according to Agentnoon requirements
3. Go to Data Management → Upload
4. Select file
5. Map columns to Agentnoon fields (if first time)
6. Review validation errors (if any)
7. Confirm upload
8. Verify data in Main Org

### Creating a Custom Field

1. Go to Settings → Fields and Attributes (or Data Management in Main Org toolbar)
2. Click "Add Field"
3. Name the field (must match CSV column if importing data)
4. Set field type (text, number, dropdown, date)
5. Configure visibility, mandatory status, auto-duplication
6. Save
7. Field now available in card content, filters, exports

### Configuring an Access Group

1. Go to Settings → Access Control → Access Groups
2. Click "Create Access Group"
3. Name the group (e.g., "Engineering Leadership")
4. Set filters:
   * Department = Engineering (users in this group only see Engineering)
   * Or Location = San Francisco (users only see SF employees)
5. Assign users to the group
6. Save
7. Users now have filtered view automatically

## Security & Data Governance

### Best Practices

* **Principle of least privilege:** Only grant admin access to those who need it
* **Regular audits:** Review user access quarterly
* **Data privacy:** Use access groups to protect sensitive information
* **Field visibility:** Hide fields like SSN, personal addresses from non-admins
* **Password policies:** Enforce strong passwords (configured in SSO if applicable)

### Sensitive Data Handling

* Never commit .env files or credentials to the Agentnoon system
* Use access groups to restrict salary visibility
* Be cautious with export permissions (exports respect access groups)

## Getting Help

### As an Admin, When to Contact Support

* Integration failures or data sync issues
* System errors or bugs
* Feature requests or configuration questions
* User access issues you can't resolve
* Data migration assistance

### Self-Service Resources

* [Support & How to Self-Help](/start-here/support-self-help)
* [Data Import Requirements](/admin-capabilities/overview-2/data-requirements)
* [Access Control Guide](/admin-capabilities/overview-1/access-groups)
* [Rate Cards Setup](/admin-capabilities/compensation-cards)

## Next Steps

* [Configuring Approval Flows](/admin-capabilities/configuring-approval-flows) - Set up scenario approvals
* [Data Refresh & Sync](/admin-capabilities/data-refresh-sync) - Manage data updates
* [Access Groups](/admin-capabilities/overview-1/access-groups) - Control who sees what
* [Fields and Attributes Management](/admin-capabilities/overview-3/fields) - Configure custom fields
* [Rate Cards](/admin-capabilities/compensation-cards) - Set up compensation automation


# Access Control

Managing user permissions and data access in Agentnoon

Access Control in Agentnoon lets you define who can see what data and what actions they can perform. Use access groups and permission settings to ensure the right people have the right level of access.

## In This Section

* [Access Groups](/admin-capabilities/overview-1/access-groups) — Create groups to manage permissions for multiple users
* [Advanced Access Controls](/admin-capabilities/overview-1/advanced-access-controls) — Fine-grained permission configuration
* [User Invitations](/admin-capabilities/overview-1/user-invitations) — Inviting new users to your Agentnoon instance
* [Updating Login Method](/admin-capabilities/overview-1/updating-login-method) — Changing how users authenticate


# Access Groups

Create access groups to manage permissions for multiple users

### Overview

Access groups in Agentnoon allow you to set permissions for data access and apply them to multiple users at once. This guide explains how to create, manage, and modify access groups.

### Navigating to Access Control

1. Click on the **Access Control** panel located at the top right of the home screen.
2. Look for the **button with two people** to enter the access group settings.

<figure><img src="https://2094208261-files.gitbook.io/~/files/v0/b/gitbook-x-prod.appspot.com/o/spaces%2FCZc46qaaBbVmMuYXPfgz%2Fuploads%2FIGXBWJNl2S9fIVCN5o0v%2FScreenshot%202026-03-06%20at%203.27.09%E2%80%AFPM.png?alt=media&amp;token=0b0afb37-ab8b-4ec0-a02b-ccc594739f65" alt=""><figcaption></figcaption></figure>

### Creating an Access Group

1. Click the **Create Access Group** button.

<figure><img src="https://2094208261-files.gitbook.io/~/files/v0/b/gitbook-x-prod.appspot.com/o/spaces%2FCZc46qaaBbVmMuYXPfgz%2Fuploads%2FFGJu5BKwNtujp1ImjUrM%2Fimage.png?alt=media&amp;token=92e78fb5-eb16-4c96-aa28-4f3b69fd2780" alt=""><figcaption></figcaption></figure>

2. Enter a **name** for the group (e.g., "HRBP Group").

<figure><img src="https://2094208261-files.gitbook.io/~/files/v0/b/gitbook-x-prod.appspot.com/o/spaces%2FCZc46qaaBbVmMuYXPfgz%2Fuploads%2FwUnTYg37tXlleIYQ6ti4%2Fimage.png?alt=media&amp;token=81acf360-8d99-48a8-8107-a8c3013fa257" alt=""><figcaption></figcaption></figure>

3. Choose permissions for different fields:

* **View access**: Users can see the field.
* **Edit access**: Users can modify the field insides scenarios
* **Hidden**: Users cannot see the field.

<figure><img src="https://2094208261-files.gitbook.io/~/files/v0/b/gitbook-x-prod.appspot.com/o/spaces%2FCZc46qaaBbVmMuYXPfgz%2Fuploads%2FTO2viL2p8jJzj2xWWKY9%2Fimage.png?alt=media&amp;token=8718c6ef-02d0-4050-9536-600f66313d78" alt=""><figcaption></figcaption></figure>

4. Categories of fields:

* **Basic fields** (general user information)
* **Compensation fields** (salary-related details)
* **Custom fields** (imported data beyond standard fields)
* Use **"Apply to All Fields"** to apply settings universally or configure them individually.

5. Use **'Features'** tab to lock / unlock specific features (e.g., exports org chart, forecast, scenarios)
6. Click **Next** to finalize and save the access group.

### Managing Access Groups

1. Click the **Manage Access Groups** button.

<figure><img src="https://2094208261-files.gitbook.io/~/files/v0/b/gitbook-x-prod.appspot.com/o/spaces%2FCZc46qaaBbVmMuYXPfgz%2Fuploads%2FnVYszzmVIpafOAkFaFob%2Fimage.png?alt=media&amp;token=aa0fba5a-ede9-48d5-bae1-4b38880d06ec" alt=""><figcaption></figcaption></figure>

2. View a list of existing access groups.
3. Options available:
   * **Edit** permissions and settings for an existing group.
   * **Delete** an access group if no longer needed.

<figure><img src="https://2094208261-files.gitbook.io/~/files/v0/b/gitbook-x-prod.appspot.com/o/spaces%2FCZc46qaaBbVmMuYXPfgz%2Fuploads%2FKsf4s8kbK66KYhs0zwU7%2Fimage.png?alt=media&amp;token=909fab4f-6a88-4953-a740-3045c0d5e1ca" alt=""><figcaption></figcaption></figure>


# Access Scope

Assign access scopes to manage area of the organizations users have access to

## **Understanding Access Scopes**

Access scopes control which people a user can access in Agentnoon.

If access groups define what someone can view or edit, access scopes define who those permissions apply to.

### **What access scopes are**

An access scope is a set of filters that narrows a user’s access to a specific part of the organization.

You can use access scopes to give someone access to:

* the entire company
* one or more departments
* one or more locations
* one or more manager hierarchies
* people who match selected custom field values (Business unit, Entity, etc)

This lets you give users the access they need without exposing the whole organization.

### **Why access scopes are useful**

Access scopes are helpful when a user should only work with a specific part of the business.

Common examples:

* an HR business partner who supports only Engineering
* a regional leader who should only see one office or country
* a people manager who should only access their reporting structure
* a specialist who works with a defined employee segment
* a user who should see a broad area, except for one excluded group

### **The main types of access scopes**

#### **Entire company**

If no filters are selected in a scope, that scope behaves like an entire-company scope.

Use this when the user’s permissions should apply across the whole board.

#### **Filtered scopes**

These are the most common scopes. They include people based on filters such as:

* Department
* Location
* Manager
* Custom fields
* Sensitive data

Manager-based scopes include the selected manager and their full reporting tree, so they work well when access should follow the org structure.

#### **Hidden scopes**

A hidden scope is used to exclude people.

This is not the same as hiding certain fields. A hidden scope removes matching people from the user’s accessible set entirely.

Use hidden scopes when someone should see a broad group, but one part of it must be excluded.

#### **Layered scopes**

A user can have more than one visible scope.

This is useful when access needs to come from more than one rule. For example, a user may need access to:

* everyone in Engineering
* plus everyone on Project Team Alpha

In that case, both visible scopes work together.

### **How filters work inside one scope**

Each scope can combine fields using AND or OR.

#### **Use AND for narrower access**

With AND, a person must match every populated field in the scope.

Example:

* Department = Sales
* Manager = VP West
* Combine fields with AND

This includes only people who are both:

* in Sales
* and in VP West’s reporting tree

#### **Use OR for broader access**

With OR, a person can match any populated field in the scope.

Example:

* Department = Sales
* Manager = VP West
* Combine fields with OR

This includes people who are:

* in Sales
* or in VP West’s reporting tree
* or both

That same pattern applies to:

* multiple departments
* multiple locations
* multiple managers
* multiple custom field values
* multiple sensitive data values

So the rule is:

* within one field, selected values behave like OR
* across different fields, the scope uses AND or OR depending on the setting

### **How multiple scopes work together**

When a user has multiple visible scopes, those scopes stack by adding access together.

That means if a person matches any visible scope, they are included.

Example:

* Scope 1: Department = Engineering
* Scope 2: Custom Field = Project Team Alpha

The user can access:

* everyone in Engineering
* plus everyone on Project Team Alpha

If a hidden scope also exists, it removes matching people from that result.

Example:

* Visible scope: Department = Sales
* Hidden scope: Manager = VP West

The user can access Sales, except for the VP West hierarchy.

### **What happens when scopes overlap**

Sometimes the same person is included by more than one visible scope.

When that happens, Agentnoon treats scopes lower in the list as more specific for that person’s field-level permissions.

In plain language:

* lower scopes in the UI take priority when the same person is covered by multiple visible scopes

This matters most when overlapping scopes use different field permissions.

### **Examples**

#### **Example 1: Department-based access**

An HRBP supports Engineering only.

Use:

* one visible scope for Department = Engineering

#### **Example 2: Multi-location access**

A leader should see London and Toronto.

Use:

* one visible scope for Location = London, Toronto

Because values in the same field behave like OR, this includes either location.

#### **Example 3: Narrow access with AND**

A user should only see Sales employees under VP West.

Use:

* Department = Sales
* Manager = VP West
* Combine fields with AND

#### **Example 4: Broader access from multiple rules**

A user should see:

* everyone in Engineering
* plus everyone on Project Team Alpha

Use:

* two visible scopes\
  or
* one broader scope using OR

#### **Example 5: Broad access with one exclusion**

A user should see all of Sales except one leader’s organization.

Use:

* visible scope: Department = Sales
* hidden scope: Manager = that leader

### **Good to know**

* Admins always have full board access, regardless of the scopes listed for them.
* Hidden scopes cannot be the only scopes a user has.
* In scenarios, newly added positions and certain related employees can appear even if they would normally sit outside a user’s main-board scope.
* If a project has its own filters, the user’s final access is the intersection of the project filter and their access scopes.

### **Summary**

Access scopes answer one question: which people should this user be able to access?

Use them to give access to:

* the whole company
* selected departments, locations, or manager hierarchies
* specific employee segments
* layered combinations of those rules

Visible scopes add access. Hidden scopes remove access. And when visible scopes overlap, lower scopes in the list are treated as more specific.


# Advanced Access Controls

Editing users, assigning multiple scopes, and export access control logs

### Overview

This guide explains how to edit user access, assign multiple scopes, and manage advanced access control settings in Agentnoon.

### Deleting a User

1. Navigate to the **Access Control Panel**.
2. Select the user you want to remove.
3. Click **Delete** to revoke their access.

<figure><img src="https://2094208261-files.gitbook.io/~/files/v0/b/gitbook-x-prod.appspot.com/o/spaces%2FCZc46qaaBbVmMuYXPfgz%2Fuploads%2FR87TDUHCMm0Qg39Zi3IS%2Fimage.png?alt=media&amp;token=d73ff67a-b602-44c9-829f-3e6659471825" alt=""><figcaption></figcaption></figure>

### Editing User Access

1. Click on a user in the **Access Control Panel**.
2. Change their **Access Group** (e.g., switch from HR to Admin).
3. Click **Update Scope** to modify their data access.

### Deleting a Scope

1. Navigate to the user’s profile.
2. Click **Delete** next to the scope you want to remove.

<figure><img src="https://2094208261-files.gitbook.io/~/files/v0/b/gitbook-x-prod.appspot.com/o/spaces%2FCZc46qaaBbVmMuYXPfgz%2Fuploads%2FiYQJgS2doxZgDlpQehM0%2Fimage.png?alt=media&amp;token=b275a0eb-69e9-4012-beff-105304c3d5af" alt=""><figcaption></figcaption></figure>

### Assigning Multiple Scopes

1. A user can have different levels of access for different teams.
2. Example:
   * **Scope 1:** HRBP Access Group → Limited access to Norma’s team.
   * **Scope 2:** Non-Admin Access Group → Limited access to the New York team.
3. This allows flexible access control, where a user sees full data for one team but limited data for another.
4. To enable this, create **separate access groups** with different field permissions and apply multiple scopes to the relevant user

<figure><img src="https://2094208261-files.gitbook.io/~/files/v0/b/gitbook-x-prod.appspot.com/o/spaces%2FCZc46qaaBbVmMuYXPfgz%2Fuploads%2Fo7PPdIDIvPKdpWO2ZUCi%2Fimage.png?alt=media&amp;token=0371c12c-d688-4ec8-9c99-38ec04795302" alt=""><figcaption></figcaption></figure>

### Exporting Access Logs

1. Click **Export Access Logs** to generate a report of user permissions.
2. This helps admins track access history and ensure compliance.

<figure><img src="https://2094208261-files.gitbook.io/~/files/v0/b/gitbook-x-prod.appspot.com/o/spaces%2FCZc46qaaBbVmMuYXPfgz%2Fuploads%2FKmZvnvY8gp5RYfMC8P9n%2Fimage.png?alt=media&amp;token=c7894985-ab33-4867-86f0-f4a72aa94200" alt=""><figcaption></figcaption></figure>

Properly managing user access ensures security and flexibility in organizational data visibility.


# User Invitations

Invite users and manage their access

### Overview

This guide explains how to invite users to Agentnoon, assign access groups, and set data scopes to control what users can view and edit.

### Inviting a User

1. Click the **Invite User** button.
2. Enter the users' details (e.g., name and email). You can also invite multiple users at once for quicker onboarding.

* New users are highlighted in green
* Existing users are highlighted in blue.\
  \&#xNAN;*Note: Email invites are sent only to new users*.

2. Choose the access type:

* **New Access**: Assign permissions from scratch.
* **Replicate Access**: Copy permissions from an existing user.

3. Select the relevant **Access Group** to determine which fields the user can view or edit.

<figure><img src="https://2094208261-files.gitbook.io/~/files/v0/b/gitbook-x-prod.appspot.com/o/spaces%2FCZc46qaaBbVmMuYXPfgz%2Fuploads%2Ft30A513qERMkuMhtL2lZ%2Fimage.png?alt=media&amp;token=a99aac76-3bfe-4e8b-81f7-4aa4b8a349d8" alt=""><figcaption></figcaption></figure>

### Understanding Scopes

Scopes define which data subsets a user can access. Unlike access groups, which control field-level permissions (e.g., salary, department visibility), scopes determine **which records the user can see**.

### Setting Scopes

1. Select the scope for the user based on imported fields such as department, location, or specific teams.
2. Recommended scope settings:
   * **Manager Scope**: Grants access to a specific manager and their direct reports.
3. You can apply **multiple filters** to refine access, such as limiting visibility to specific departments within a manager’s team.
4. You can also choose Select All Data, which allows admins to quickly grant access to the entire company.
5. Click **Apply** to finalize scope settings.

<figure><img src="https://2094208261-files.gitbook.io/~/files/v0/b/gitbook-x-prod.appspot.com/o/spaces%2FCZc46qaaBbVmMuYXPfgz%2Fuploads%2Fgit-blob-38dbeabc04ebb2dd8f802004cbd5f12cce2374e7%2FScreenshot%202025-06-16%20at%202.21.20%E2%80%AFPM.png?alt=media" alt=""><figcaption></figcaption></figure>

### Completing the Invitation

1. New user receives an **email invitation** to join Agentnoon.
2. You can monitor their invitation status from the access control panel.

By properly setting access groups and scopes, you ensure users only see relevant data while maintaining security and efficiency.


# Updating Login Method

Update your authentication and switch to SSO

### **Overview**

If you need to change how you log in, follow these steps to update your authentication method:

### Log in to Your Agentnoon Account

Sign in to Agentnoon as you normally would using your existing authentication provider (e.g., email, Google, or another SSO method).

### Open Your Profile Settings

* Click on your profile icon in the top right corner of the screen.
* A dropdown menu will appear.
* Select **"Update Authentication"** from the dropdown menu.

<figure><img src="https://2094208261-files.gitbook.io/~/files/v0/b/gitbook-x-prod.appspot.com/o/spaces%2FCZc46qaaBbVmMuYXPfgz%2Fuploads%2Fgit-blob-3b3faa39da996386cc74574067389de33a31062e%2FIMG_6781.png?alt=media" alt=""><figcaption></figcaption></figure>

### Update Authentication Method

* A list of available authentication providers will be displayed.
* Choose a new login method from the list (e.g., switch from email/password to Google SSO).

<figure><img src="https://2094208261-files.gitbook.io/~/files/v0/b/gitbook-x-prod.appspot.com/o/spaces%2FCZc46qaaBbVmMuYXPfgz%2Fuploads%2Fgit-blob-bd7a67db05bd348adb9ffbd8da3b0fc131ca398b%2FIMG_6780.png?alt=media" alt=""><figcaption></figcaption></figure>

### Complete the Setup

* Follow the instructions to set up your new login method.
* Once done, the system will take you back to the home page.

### Confirm Your New Login Method

* Open the profile menu again and select "Sign out".
* Now, sign back in using the newly selected authentication method to confirm the update.

<figure><img src="https://2094208261-files.gitbook.io/~/files/v0/b/gitbook-x-prod.appspot.com/o/spaces%2FCZc46qaaBbVmMuYXPfgz%2Fuploads%2Fgit-blob-ec9c80a2ad8e4fd52e105405d73ade5ca2822225%2FIMG_6779.png?alt=media" alt=""><figcaption></figcaption></figure>

Your login method is now updated! If you face any issues, contact support for assistance.


# General Settings

Set your organization's name, currency, and other core details

### Overview

This guide explains how to customize your organization's settings in Agentnoon, including renaming your instance, setting a default currency, updating branding, and customizing org chart colors.

<figure><img src="https://2094208261-files.gitbook.io/~/files/v0/b/gitbook-x-prod.appspot.com/o/spaces%2FCZc46qaaBbVmMuYXPfgz%2Fuploads%2Fgit-blob-5568f2d7f447b69f54d3aa7794d85d1d6bec338c%2FScreenshot%202025-07-15%20at%204.16.38%E2%80%AFPM.png?alt=media" alt=""><figcaption></figcaption></figure>

### Renaming Your Organization

1. Navigate to the **Settings** panel.
2. Enter a new name for your organization.
3. This updates the **instance name** across the platform.

### Setting Default Currency

1. Select your **default currency**.
2. All numbers will be converted using publicly available exchange rates.
3. You can still **import data in multiple currencies**, but reports will display rolled-up values in the selected default currency.

### Setting Default Views

1. Select a board or scenario with pre-configured views.
2. Add the users you want to assign a default view to.
3. The selected view will automatically load as their default when they open the board

### Setting Org Level Approval Configuration

1. Select the Level 1 and Level 2 approvers for your scenarios' approval workflow.
2. These approvers will be responsible for reviewing and approving changes within the scenario.
3. Only admins have permission to configure org level approvers.

### Customizing Branding

1. **Upload your logo** to replace the Agentnoon default logo.
2. **Set your brand color** to personalize your instance, charts, and interface. Go to Settings, then to the Colors tab, and find the Hub Chart Colors section to set your brand's color combinations. Color 1 is used to set the primary color.
3. Enter a **hex or color code** to precisely define your brand’s color.

### Setting Org Chart Roots

1. **Select one or more employees** to act as **root nodes** for your org chart.
2. Ideal for visualizing disconnected teams, business units, or parallel structures.
3. Your selected roots will define the **default** starting point in your main org chart.

### Setting Fiscal Start Month

Define the month your fiscal year begins to ensure all headcount, cost, and planning reports align with your organization’s financial calendar. This helps keep scenario budgets and workforce cost projections consistent with how finance tracks spend.

These settings help tailor the platform to your organization’s identity while ensuring consistency in data presentation.


# Data Upload & Management

Managing data uploads, imports, and field configuration

This section covers everything related to getting your organizational data into Agentnoon and keeping it accurate.

## In This Section

* [Data Requirements](/admin-capabilities/overview-2/data-requirements) — What data you need and how to format it
* [Attributes Overview](/admin-capabilities/overview-2/attributes-overview) — Understanding position and employee attributes
* [Data Error Checklist](/admin-capabilities/overview-2/data-error-checklist) — Common import errors and how to fix them
* [Data Import](/admin-capabilities/overview-2/data-import) — Step-by-step guide to uploading and mapping your data
* [Partial Data Upload](/scenarios/advanced-actions/partial-data-upload) — Uploading data for specific scenarios
* [Formulas](/admin-capabilities/overview-2/formulas) — Using formulas in your data


# Data Requirements

Basic data field requirements to get started

### Overview

This guide explains the essential fields required to set up data in Agentnoon, along with additional custom fields for advanced functionality.

### Three Required Fields

1. **Position ID**: A unique identifier for each position (can be a number or letter, as long as it's unique).
2. **Manager’s Position ID**: Defines reporting relationships by linking a position to its manager.
   * Example: If Ali's Position ID is `1` and Shayan's Position ID is `2`, and Shayan reports to Ali, then Shayan’s **Manager’s Position ID** is `1`.
3. **Job Title**: The title assigned to each position (e.g., CEO, Head of Product) to display on the org chart.

### Custom Fields

* You can import unlimited custom fields, such as:
  * **Department**
  * **Name**
  * **Location**
  * **Employment Status**
  * **Start Dates and End Dates** (useful for tracking hires, planned terminations, and generate accurate forecasts)

### Employee vs. Position Fields

* For advanced functionality (e.g., talent selection, reassigning employees between positions), you need to distinguish between:
  * **Position Fields** (attributes tied to a role, not a specific person)
  * **Employee Fields** (attributes tied to an individual, such as personal details)
* This distinction is managed in the **data import mechanism**, covered in a separate guide.

By setting up these fields correctly, you ensure accurate org visualization and enable more advanced workforce planning capabilities.


# Attributes Overview

Understanding attribute types and how to manage them

### Overview

This guide explains what attributes are in Agentnoon, the different types, and how to edit and manage them. Attributes help structure and analyze organizational data within the platform.

### Types of Attributes

#### 1. Imported Attributes

* These are data fields uploaded into Agentnoon (e.g., **Name, Job Title, Location**).
* Once imported, attributes can be:
  * Used for **filtering** and **displaying** on the org chart.
  * **Analyzed** in workforce hub and reporting.
  * **Grouped** for segmentation and insights.

#### 2. Calculated Attributes

* These are system-generated attributes based on existing data.
* Examples include:
  * **Layers** (depth in the hierarchy).
  * **Spans of Control** (number of direct reports).
  * **Rollups** (aggregated metrics for teams).
* These are useful for **org design analysis** and **structural insights**.

<figure><img src="https://2094208261-files.gitbook.io/~/files/v0/b/gitbook-x-prod.appspot.com/o/spaces%2FCZc46qaaBbVmMuYXPfgz%2Fuploads%2FaPRgdBa9GwkiXkxHWvX8%2Fimage.png?alt=media&amp;token=a523296e-db88-42f4-a5cd-28d9a30dc0d6" alt=""><figcaption></figcaption></figure>

#### 3. State Attributes

* These are fields that must be filled when changing the state of an employee within a scenario - such as adding a new hire, closing a position, or assigning a backfill.
* For example, When a user clicks the **+ Add Role** to add a new hire, they’ll be prompted to fill out required fields such as:
  * Role
  * Office Location
  * Start Date
* State attributes help standardize planning workflows by prompting users to enter essential information during structural changes.

<figure><img src="https://2094208261-files.gitbook.io/~/files/v0/b/gitbook-x-prod.appspot.com/o/spaces%2FCZc46qaaBbVmMuYXPfgz%2Fuploads%2F2PQT7ly4ndXisTANgLOc%2Fimage.png?alt=media&amp;token=568a0bfe-b4b1-4cf1-aefa-6fcfd2af6182" alt=""><figcaption></figcaption></figure>

### Editing and Managing Global Attributes

#### 1. Adding New Attributes

You can create new attributes from **Data Management > Attributes & Formulas**

#### 2. Steps to Add or Edit Attributes

1. Navigate to **Data Management → Attributes & Formulas**.
2. Click **Add New Attribute** to create a new field.
3. Modify an existing attribute:
   * Rename it for clarity.
   * Adjust its type (**text, number, monetary, date, array etc.**).
4. Save changes to apply them across the org chart or scenario.

### Multiple Values (Array Fields)

You can store multiple values in a single field (for example, Skills, Certifications, or Clients) and use them in filters across the product.

#### How it works

When a field is set to Array type, values separated by commas are treated as individual items.

Example:

Analytics, AI, Account Management

Will be treated as:

* Analytics
* AI
* Account Management

These values will appear separately in filters instead of one combined string.

#### Setup

1. Import your field like a normal custom field
   * Example: Skills = Analytics, QA, Management
2. Go to Settings → Fields (Attributes & Formulas)
3. Edit the field
4. Change type from Text → Array
5. Save

#### Using Array Fields in Filters

* Each value appears as a separate, unique option
* Selecting a value returns all records that contain that value<br>

For multiple selections:

* Any of → matches at least one value
* All of → matches all selected values

#### Where this applies

Array fields work in:

* Filters (Org Chart, Workforce Hub, etc.)
* Highlighting and analytics
* Any place where filters are supported

#### Notes

* Values must be separated by commas
* Each value appears only once in filters (no duplicates)
* In card content and exports, values remain comma-separated

<figure><img src="https://2094208261-files.gitbook.io/~/files/v0/b/gitbook-x-prod.appspot.com/o/spaces%2FCZc46qaaBbVmMuYXPfgz%2Fuploads%2FWUz9b5Nlaven6nUAx7JW%2Fimage.png?alt=media&amp;token=6475fc56-5e7f-49b7-8f69-42a3f9532390" alt=""><figcaption></figcaption></figure>


# Data Error Checklist

Common data errors to avoid when uploading data into Agentnoon

### Overview

To ensure a smooth experience when uploading your CSV or Google Sheets files, follow this checklist. Completing each step will help prevent errors and ensure accurate data processing.

### Required Data Structure

* **Single Header Row**: Ensure all column headers are in the first row.
* **Unique Column Names**: No duplicate headers.
* **All Columns Have Headers**: No missing column names.
* **No Blank Columns**: Remove empty columns.
* **Date Format**: Use 1 date format for consistency.
* **File Encoding**: Save the CSV in **UTF-8** encoding to avoid character issues.
* **Consistent Text Formatting**: Standardize capitalization and remove extra spaces.
* **No Special Characters**: Avoid symbols or emojis that may interfere with data processing.
* **Supported File Format**: Use **CSV (.csv)** or **Google Sheets format**. For automated integration contact Agentnoon support.

### Mandatory Data Fields

* **Required Fields Completed**: Ensure all mandatory fields are filled.
* **Unique Employee IDs**: Each employee must have a distinct Employee ID.
* **Valid Manager IDs**: Manager IDs must correspond to existing Employee IDs.
* **No Self-Reporting**: An employee **cannot** be their own manager.
* **No Circular Reporting**: Ensure reporting structures do not loop back on themselves.
* **Manager Assignments**: All employees needing a manager must have one assigned.

### Data Validation

* **Field Dependencies**: Ensure fields like **cost center → department** follow required logic.
* **Data Type Consistency**:
  * Numeric fields contain only numbers.
  * Decimal values maintain a standard precision (e.g., two decimal places).
* **Currency Codes**:
  * Use standard three-letter currency codes (**USD, EUR, etc.**).
  * Ensure currency matches salary amounts consistently.
* **Consistent Department & Location Names**: Standardized naming for data integrity.
* **Data Completeness**: No empty mandatory fields (e.g., **Employee ID, Manager ID, Job Title**).
* **No Duplicate Records**: Remove any repeated employee entries.
* **Top-Level Managers**: If applicable, leave **Manager ID** blank or assign a valid value.
* **No Orphan Records**: Every **Manager ID** must correspond to an existing **Employee ID**.
* **Unauthorized Field Entries:** Monitor for unapproved additions to fields like Position Title, especially during scenario planning.
* **Circular Reporting:** Looks for reporting loops, like a manager reporting to someone who reports back to them directly or indirectly.

### Salary & Compensation

* **Salaries Are Valid**:
  * Salary values must be **positive numbers**.
  * Amounts must align with the assigned currency.
* **Salary Outliers:** Review compensation values for outliers compared to similar job families, grades, or levels.

### Date Validation

* **Date Format**: Use 1 date format for all dates for consistency.
* **Logical Date Entries**: Ensure dates make sense (e.g., **Hire Date** is after **Birth Date**).

### Consistency & Clean Data Practices

* **Consistent Text Entries**: No typos or variations in naming conventions.
* **No Formulas in Cells**: Only raw data should be present, without embedded formulas or macros.
* **Proper Use of Special Characters**: Ensure correct handling of commas, quotes, or other characters in CSV files.

### Error Handling & Validation

Agentnoon automatically validates data upon upload. If errors are found:

* **Error Reports**: You can export a report of incorrect records for review.
* **Field Mapping Adjustments**: If there are mismatches, the system will prompt you to adjust mappings.

### Best Practices

* **Consistent Formatting**: Keep data structured correctly to avoid import errors.
* **Data Accuracy**: Review information for correctness before uploading.
* **Version Control**: Maintain copies of previous data files for tracking and rollback purposes.

By following this checklist, you ensure a seamless data upload process in Agentnoon.


# Data Import

Import your position and employee data into Agentnoon

### Overview

This guide explains how to import data into Agentnoon, map attributes correctly, and distinguish between position and employee-level fields for accurate management.

#### 1. Uploading the File

1. Navigate to **Data Management → Import Data**.
2. Choose your file type (**Google Sheets or CSV**).
3. If using Google Sheets, paste the link.
4. Click **Upload** to begin processing the file.

*\*Note that if you are a Enterprise customer that has Integrations enabled, Agentnoon will set up a live integration to your data seperately as part of the onboarding process. This is for customers who want to do a flat file upload.*

#### 2. Mapping Core Attributes

After uploading, you will need to map key fields:

1. **Position ID**: A unique identifier for each role.
2. **Manager’s Position ID**: Defines reporting relationships.
3. **Salary & Currency**: Select the relevant columns if you have multiple currencies. If not, you can set a default currency in **Settings**.

#### 3. Mapping Custom Fields

Custom fields allow flexibility in structuring your data.

* **Employee-Level Data**: Fields tied to an individual (e.g., Name, Birth Date).
* **Position-Level Data**: Fields tied to a role (e.g., Job Title, Department).
* **Start & End Dates**: Map these fields to track hiring and termination dates.

### Understanding Employee vs. Position Data

* When an **employee is attached** to a position, their **employee-level** data is added to the position.
* If an **employee is detached**, their **employee-level** data is removed, leaving only position-level details.
* If you **don’t need this distinction**, you can import everything as **custom fields** without separation.

<div><figure><img src="https://2094208261-files.gitbook.io/~/files/v0/b/gitbook-x-prod.appspot.com/o/spaces%2FCZc46qaaBbVmMuYXPfgz%2Fuploads%2Fgit-blob-d595fa4b16be1adcf3978d66e45b74e0b5b2ba1d%2F1740697820408.jpeg?alt=media" alt=""><figcaption></figcaption></figure> <figure><img src="https://2094208261-files.gitbook.io/~/files/v0/b/gitbook-x-prod.appspot.com/o/spaces%2FCZc46qaaBbVmMuYXPfgz%2Fuploads%2Fgit-blob-0ce9f3d1773e18921e0237fa56548c8e31a0c8e4%2F1740697821348.jpeg?alt=media" alt=""><figcaption></figcaption></figure></div>

By correctly mapping attributes, you ensure accurate org visualization, talent selection, and workforce planning in Agentnoon.


# Formulas

Create and apply custom formulas to using your own data fields.

### Overview

Custom formulas in Agentnoon allow you to define new calculated fields using existing attributes in your data - such as compensation - in natural language. These formulas can be used to model costs, estimate severance, apply benchmarks, or capture any custom logic specific to your planning needs. Formulas help turn raw data into actionable metrics.

### Setting up a Custom Formula

1. **Creating a formula:** Navigate to the Attributes and Formulas section and click Add New Formula. Give your formula a clear, recognizable name.
2. **Use variables from your data:** From the Available Variables panel, select the data fields you want to include - such as Level, Service\_Years, or Full\_Compensation.
3. **Write your formula logic:**
   * Use basic math operations, existing variables, and conditional logic to define your formula. Conditional logic allows you to apply different rules based on specific conditions.
   * You can use supported functions like ifElse, in, min, max, and arithmetic operations.

<figure><img src="https://2094208261-files.gitbook.io/~/files/v0/b/gitbook-x-prod.appspot.com/o/spaces%2FCZc46qaaBbVmMuYXPfgz%2Fuploads%2Fgit-blob-4c5f07dc8c8a90c22110be91e3060a4326d9df35%2Fimage%20(22).png?alt=media" alt=""><figcaption></figcaption></figure>

**Example:**\
\
Suppose you need to calculate severance for employees marked as "RIF" (Reduction in Force).\
The formula could be structured as:\
ifElse(in("RIF", \[scenarioState]), max(min(\[Service\_Years], 25), ifElse(\[Level] <= 7, 5, ifElse(\[Level] <= 12, 7, 19))), 0) \* (\[Full\_Compensation] / 25)\
\
This formula considers service years and employee level to determine the severance amount, ensuring precise calculations based on your specific criteria.

<figure><img src="https://19874675.fs1.hubspotusercontent-na1.net/hubfs/19874675/image-png-Dec-12-2024-04-52-34-8159-PM.png" alt=""><figcaption></figcaption></figure>


# Rate Cards / Compensation Bands

Auto populate salaries using your compensation bands

### Overview

This guide explains how rate cards work in Agentnoon, allowing organizations to standardize salary structures based on role levels and locations.

### Uploading a Rate Card

1. Prepare your **rate card / compensation bands** as a .CSV file

<figure><img src="https://2094208261-files.gitbook.io/~/files/v0/b/gitbook-x-prod.appspot.com/o/spaces%2FCZc46qaaBbVmMuYXPfgz%2Fuploads%2Fgit-blob-9b08a3ab29c41a05690ad5b5dc796ede83d8c43f%2FScreenshot%202025-03-06%20at%209.01.13%E2%80%AFAM.png?alt=media" alt="" width="375"><figcaption></figcaption></figure>

2. Navigate to **Upload & Map Data** and upload the CSV.
3. Once uploaded, the data appears in a table with all attributes displayed

<figure><img src="https://2094208261-files.gitbook.io/~/files/v0/b/gitbook-x-prod.appspot.com/o/spaces%2FCZc46qaaBbVmMuYXPfgz%2Fuploads%2Fgit-blob-67282534cb4847b808e0626e9e553ab5e1e41d7d%2FScreenshot%202025-03-06%20at%208.59.29%E2%80%AFAM.png?alt=media" alt=""><figcaption></figcaption></figure>

### Mapping Salary Attributes

1. Select the attributes that define salary (e.g., **Level** and **Country**).
2. Choose the field that updates the salary (e.g., **Salary** field).
3. This ensures that salary values are dynamically populated based on predefined attributes.

### Using Rate Cards in Scenarios

1. Inside a scenario, create a new role.
2. Open **Card Content** and enable **Rate Card**.
3. Select the **Country** and **Level** for the role (or any other fields that you have defined in your upload)
4. The salary auto-populates based on the mapped rate card values, similar to a **VLOOKUP** function.

### Organizing Rate Card Fields

1. You can Group rate card fields (e.g., **Country** and **Level**) for better organization using the Groups functionality in the Fields menu.

Rate cards help enforce structured compensation bands and prevent arbitrary salary inputs across the organization.


# Auto Mapping

Auto-mapping automatically maps attributes using configurable rules to ensure consistency and reduce manual work.

### Setting Up Auto-Mapping

Auto-mapping rules are configured within **Settings**.

<figure><img src="https://2094208261-files.gitbook.io/~/files/v0/b/gitbook-x-prod.appspot.com/o/spaces%2FCZc46qaaBbVmMuYXPfgz%2Fuploads%2F4LIvMoyjINbqgiFb1zIk%2Fimage.png?alt=media&amp;token=ef6521cb-2652-4423-af7a-4c84d53f3e5d" alt=""><figcaption></figcaption></figure>

To create an auto-mapping rule:

1. Navigate to **Settings**.
2. Create a new rule and provide a name and description.

<figure><img src="https://2094208261-files.gitbook.io/~/files/v0/b/gitbook-x-prod.appspot.com/o/spaces%2FCZc46qaaBbVmMuYXPfgz%2Fuploads%2Fwbedn0sRAH1VCOFiBw7H%2Fimage.png?alt=media&amp;token=1c0f6a5c-5e56-4d89-ba36-03c3a148c7a4" alt=""><figcaption></figcaption></figure>

3. Upload a CSV file containing the mapping logic.
4. Click on Create Rule.

Once the file is uploaded, the system guides you through configuring how the mapping should be applied.

<figure><img src="https://2094208261-files.gitbook.io/~/files/v0/b/gitbook-x-prod.appspot.com/o/spaces%2FCZc46qaaBbVmMuYXPfgz%2Fuploads%2Fgit-blob-7005addc8b1a62e39011c2224cb3c159344a9148%2FScreenshot%202026-01-30%20at%2012.01.03%E2%80%AFPM.png?alt=media" alt=""><figcaption></figcaption></figure>

### Configuring the Mapping Logic

After uploading the CSV:

1. Select the column(s) that will act as the **independant attribute(s)** (e.g. National Department).
2. The remaining columns will be treated as **dependant attributes** (e.g. Location and International Department), that are automatically populated when a source value is selected or updated.

<figure><img src="https://2094208261-files.gitbook.io/~/files/v0/b/gitbook-x-prod.appspot.com/o/spaces%2FCZc46qaaBbVmMuYXPfgz%2Fuploads%2Fgit-blob-ca7e9a7875d7d4608907975eb61406ebea7e8f0a%2FScreenshot%202026-01-30%20at%2012.04.56%E2%80%AFPM.png?alt=media" alt=""><figcaption></figcaption></figure>

#### Example

If a source value is selected (e.g., a locally defined attribute), one or more standardized values are automatically populated based on the configured mapping.

Once confirmed, the auto-mapping rule becomes active and is applied consistently across the organization.

### Modifying Existing Records

When an existing record is updated:

* Changing the source attribute automatically updates the mapped target attributes according to the rule.

This is particularly helpful when regional or team-specific terminology differs from standardized or global definitions.

### Creating New Records

When creating a new record:

1. Define the record and its position within the structure.
2. Assign a source attribute (e.g.: National Department)

<figure><img src="https://2094208261-files.gitbook.io/~/files/v0/b/gitbook-x-prod.appspot.com/o/spaces%2FCZc46qaaBbVmMuYXPfgz%2Fuploads%2Fgit-blob-bf765423fdae736fe6670e67459393faba5220ff%2FScreenshot%202026-01-30%20at%2012.10.41%E2%80%AFPM.png?alt=media" alt="" width="210"><figcaption></figcaption></figure>

3. The relevant target attributes are automatically populated based on the active auto-mapping rule.

This ensures new data aligns with organizational standards from the outset, without requiring additional manual steps.


# Fields and Attributes Management

Configuring fields, attributes, and platform settings

Manage the fields and attributes that define your organizational data in Agentnoon. Configure field groups, visibility, duplication rules, and platform settings.

## In This Section

* [Fields](/admin-capabilities/overview-3/fields) — Creating field groups, enabling/disabling fields, auto-duplication, and restricted values


# Fields

Configuring field groups, visibility, duplication, and dropdown values

### Overview

This guide explains how to manage field settings in Agentnoon, including creating field groups, enabling or disabling fields, setting up auto-duplication, and using restrictive values.

### Creating Field Groups

1. Navigate to **Field Settings**.
2. Create a **new group** and assign fields to it.
3. Grouping fields helps organize the edit sidebar based on groups, improving workflow efficiency

<figure><img src="https://2094208261-files.gitbook.io/~/files/v0/b/gitbook-x-prod.appspot.com/o/spaces%2FCZc46qaaBbVmMuYXPfgz%2Fuploads%2Fgit-blob-775772bba44a67dff6dd8697330d3e71cc6d94e2%2FScreenshot%202025-03-06%20at%207.54.29%E2%80%AFAM.png?alt=media" alt=""><figcaption></figcaption></figure>

### Enabling or Disabling Fields

1. Toggle **on or off** specific fields to control visibility.
2. Disabled fields will not appear in:
   * Org charts
   * Card content
   * Filter menus
   * Hub charts
3. This ensures users only see relevant fields in the platform.

### Setting Up Auto-Duplication

1. Select which fields should **auto-duplicate** when copying positions or creating new direct reports under a Manager in the org chart.
2. Enabled fields will be copied automatically, while others require manual input and will be blank by default
3. This feature is useful when creating multiple similar roles or wanting to carry over fields from a Manager when creating direct reports (e.g., Manager and Direct Report should have the same department)

<figure><img src="https://2094208261-files.gitbook.io/~/files/v0/b/gitbook-x-prod.appspot.com/o/spaces%2FCZc46qaaBbVmMuYXPfgz%2Fuploads%2Fgit-blob-c4e3578ac3c1f5ea053b71971c80181bdd4cc0f0%2FScreenshot%202025-11-11%20at%205.48.14%E2%80%AFPM.png?alt=media" alt="" width="375"><figcaption></figcaption></figure>

### Using Restricted Values

1. Instead of allowing free-form text, enable **drop-down lists** with predefined values.
2. Users will only be able to select from these fixed options.
3. Helps maintain data consistency and prevents unnecessary variations in field values.
4. Admins still have the ability to add free form text if they prefer

<figure><img src="https://2094208261-files.gitbook.io/~/files/v0/b/gitbook-x-prod.appspot.com/o/spaces%2FCZc46qaaBbVmMuYXPfgz%2Fuploads%2F9WuuYWExtLRdTCPAo49I%2Fimage.png?alt=media&amp;token=14c30fb7-f2fa-4795-84c9-11c19efe7711" alt=""><figcaption></figcaption></figure>

Proper field management ensures structured data input, controlled visibility, and efficient org chart operations in Agentnoon.

## Visual Guide

<figure><img src="https://2094208261-files.gitbook.io/~/files/v0/b/gitbook-x-prod.appspot.com/o/spaces%2FCZc46qaaBbVmMuYXPfgz%2Fuploads%2FVsGigFWH3CDBpg1rrqvV%2Fimage.png?alt=media&amp;token=cf480f82-eb85-41c0-aa69-0b0c8b44ae35" alt=""><figcaption></figcaption></figure>


# Configuring Approval Flows

Setting up and managing scenario approval workflows

Approval flows route scenarios through multi-level review before implementation. As an admin, you configure global approvers in Settings and document how scenario-specific approvers work.

## The 4-Level Approval System

**Levels 1 & 2: Global Approvers** — Set in Settings > General > Approval Workflows; apply to all scenarios org-wide.

**Levels 0 & 3: Scenario-Specific Approvers** — Set per scenario when submitting; apply to that scenario only.

**Approval order:** Level 0 (scenario-specific, first) → Level 1 (global) → Level 2 (global) → Level 3 (scenario-specific, last)

You don't have to use all levels. Most organizations use only Levels 1 and 2.

## Configuring Global Approvers (Levels 1 & 2)

1. Settings > **General** > scroll to "Approval Workflows"
2. Click "Add Level 1 Approver" > select user(s)
3. Click "Add Level 2 Approver" > select user(s)
4. Enable **"Lock Scenarios Upon Submission"** (strongly recommended — prevents edits during review)
5. Save

**With multiple Level 1 approvers:** Any one approver can approve to advance; if any rejects, the scenario is rejected.

**Typical approvers:**

* Level 1: HR Business Partners, Department heads
* Level 2: CFO, CHRO, COO — whoever has final budget authority

## Setting Scenario-Specific Approvers (Levels 0 & 3)

Done by the scenario creator at submission time, not in Settings:

1. Open scenario > **OpEx Panel** > scroll to bottom > **Configure Submission**
2. Set Level 0 (first approver, e.g., direct manager) and/or Level 3 (final approver, e.g., executive sponsor) if needed
3. Add justification explaining the scenario purpose, headcount change, and cost impact
4. Click **Submit**

## The Approval Process (Approver's View)

1. Approver receives notification (email or in-app)
2. Opens scenario > views OpEx Panel
3. Reviews each change (green = add, red = reduce, blue = modify) and cost/headcount impact
4. Approves (✅) or Rejects (❌) each change with a reason
5. Clicks **Send Decision**

**Note:** Currently all-or-nothing — if any change is rejected, the entire scenario is returned to the creator.

## After Rejection

Scenario unlocks and returns to the creator with approval history intact. The creator revises and resubmits. Previously approved positions stay approved on resubmission — approvers only need to review new or changed items.

## Common Approval Designs

**Simple (2-level):** Level 1 = HR Business Partner; Level 2 = Finance Director. For small/mid organizations.

**Standard (3-level):** Level 1 = Department heads (any one can approve); Level 2 = Finance; Level 3 (scenario-specific) = Executive sponsor for major changes.

**Complex (4-level):** Level 0 = Manager of scenario creator; Level 1 = VP; Level 2 = CFO; Level 3 = Executive committee. For large enterprises with strict governance.

## Troubleshooting

| Problem                                             | Solution                                                                          |
| --------------------------------------------------- | --------------------------------------------------------------------------------- |
| Scenario stuck in approval                          | Follow up with approver directly; admin can reassign if urgent                    |
| Scenario not locking after submission               | Enable "Lock Scenarios Upon Submission" in Settings > General                     |
| Approver can't find the scenario                    | Verify approver has access to that org scope and is assigned at the correct level |
| Need partial approval (approve some, reject others) | Not currently supported; workaround: split into multiple smaller scenarios        |

## Related Articles

* [Scenario Approvals (User Guide)](/scenarios/approvals)
* [Admin Overview](/admin-capabilities/overview)
* [Access Groups](/admin-capabilities/overview-1/access-groups)


# Data Refresh & Sync

Keeping Agentnoon synchronized with your HRIS data

Keep your Main Org current by uploading fresh data manually or setting up automated sync with your HRIS.

## Manual CSV Refresh

**Full data upload** — Replaces all Main Org data. Use when you want a clean refresh from your HRIS.

1. Export latest data from HRIS
2. Main Org > Toolbar > **Data Management** > **Upload Full Data**
3. Choose CSV, map fields (first upload only), review validation, confirm
4. Spot-check: new hires appear, recent terminations removed, org chart intact

**Note:** Any record NOT in the CSV is removed from Main Org.

## Automated Sync (Live Integrations)

Three integration methods are available (Admin > Settings > Data Management):

* **SFTP** — Agentnoon connects to your SFTP server and pulls CSV files on a schedule
* **Workday** — Direct API integration for Workday customers
* **REST API** — Your systems push data to Agentnoon endpoints

**Recommended sync frequency:** Weekly (Sunday night or Monday morning). Daily is available for fast-moving organizations.

**Monitoring:** Settings > Data Management > Integration Status shows last sync time, success/failure status, and error logs.

**Healthy indicators:** Completed within expected timeframe; no errors; record count matches HRIS; recent hires and terminations reflected.

## What Happens During Refresh

1. Validation (required fields, data types, format)
2. Matching to existing records by Employee ID
3. Updates (changed fields), additions (new employees), removals (departed employees)
4. Org chart hierarchy reconstruction and metric recalculation

**Duration:** 5–15 minutes for <5,000 employees; larger orgs take longer.

**During refresh:** Users may see a "Data refresh in progress" banner; org chart may be temporarily unavailable. Scenarios remain accessible.

## Scenario Refresh

Main Org refreshes do NOT automatically update scenarios. Scenarios are snapshots that preserve your planned changes.

**When to refresh a scenario:** Your scenario is months old and you want to incorporate recent Main Org changes before submitting for approval.

1. Open the scenario > Data Management > **Refresh Scenario**
2. Review what will change (new employees, removed employees, field updates)
3. Confirm — your scenario changes are preserved; only the baseline updates

**Note:** Scenario refresh is in development. Contact support to confirm availability.

## Troubleshooting Common Issues

| Problem                           | Solution                                                                                                                                      |
| --------------------------------- | --------------------------------------------------------------------------------------------------------------------------------------------- |
| New hire not appearing            | Check if HRIS exported them; verify sync has run since hire was added; check for validation errors                                            |
| Terminated employee still showing | Verify HRIS processed termination; wait for next sync (will auto-remove); or upload corrected CSV. Contact support if the issue still exists. |
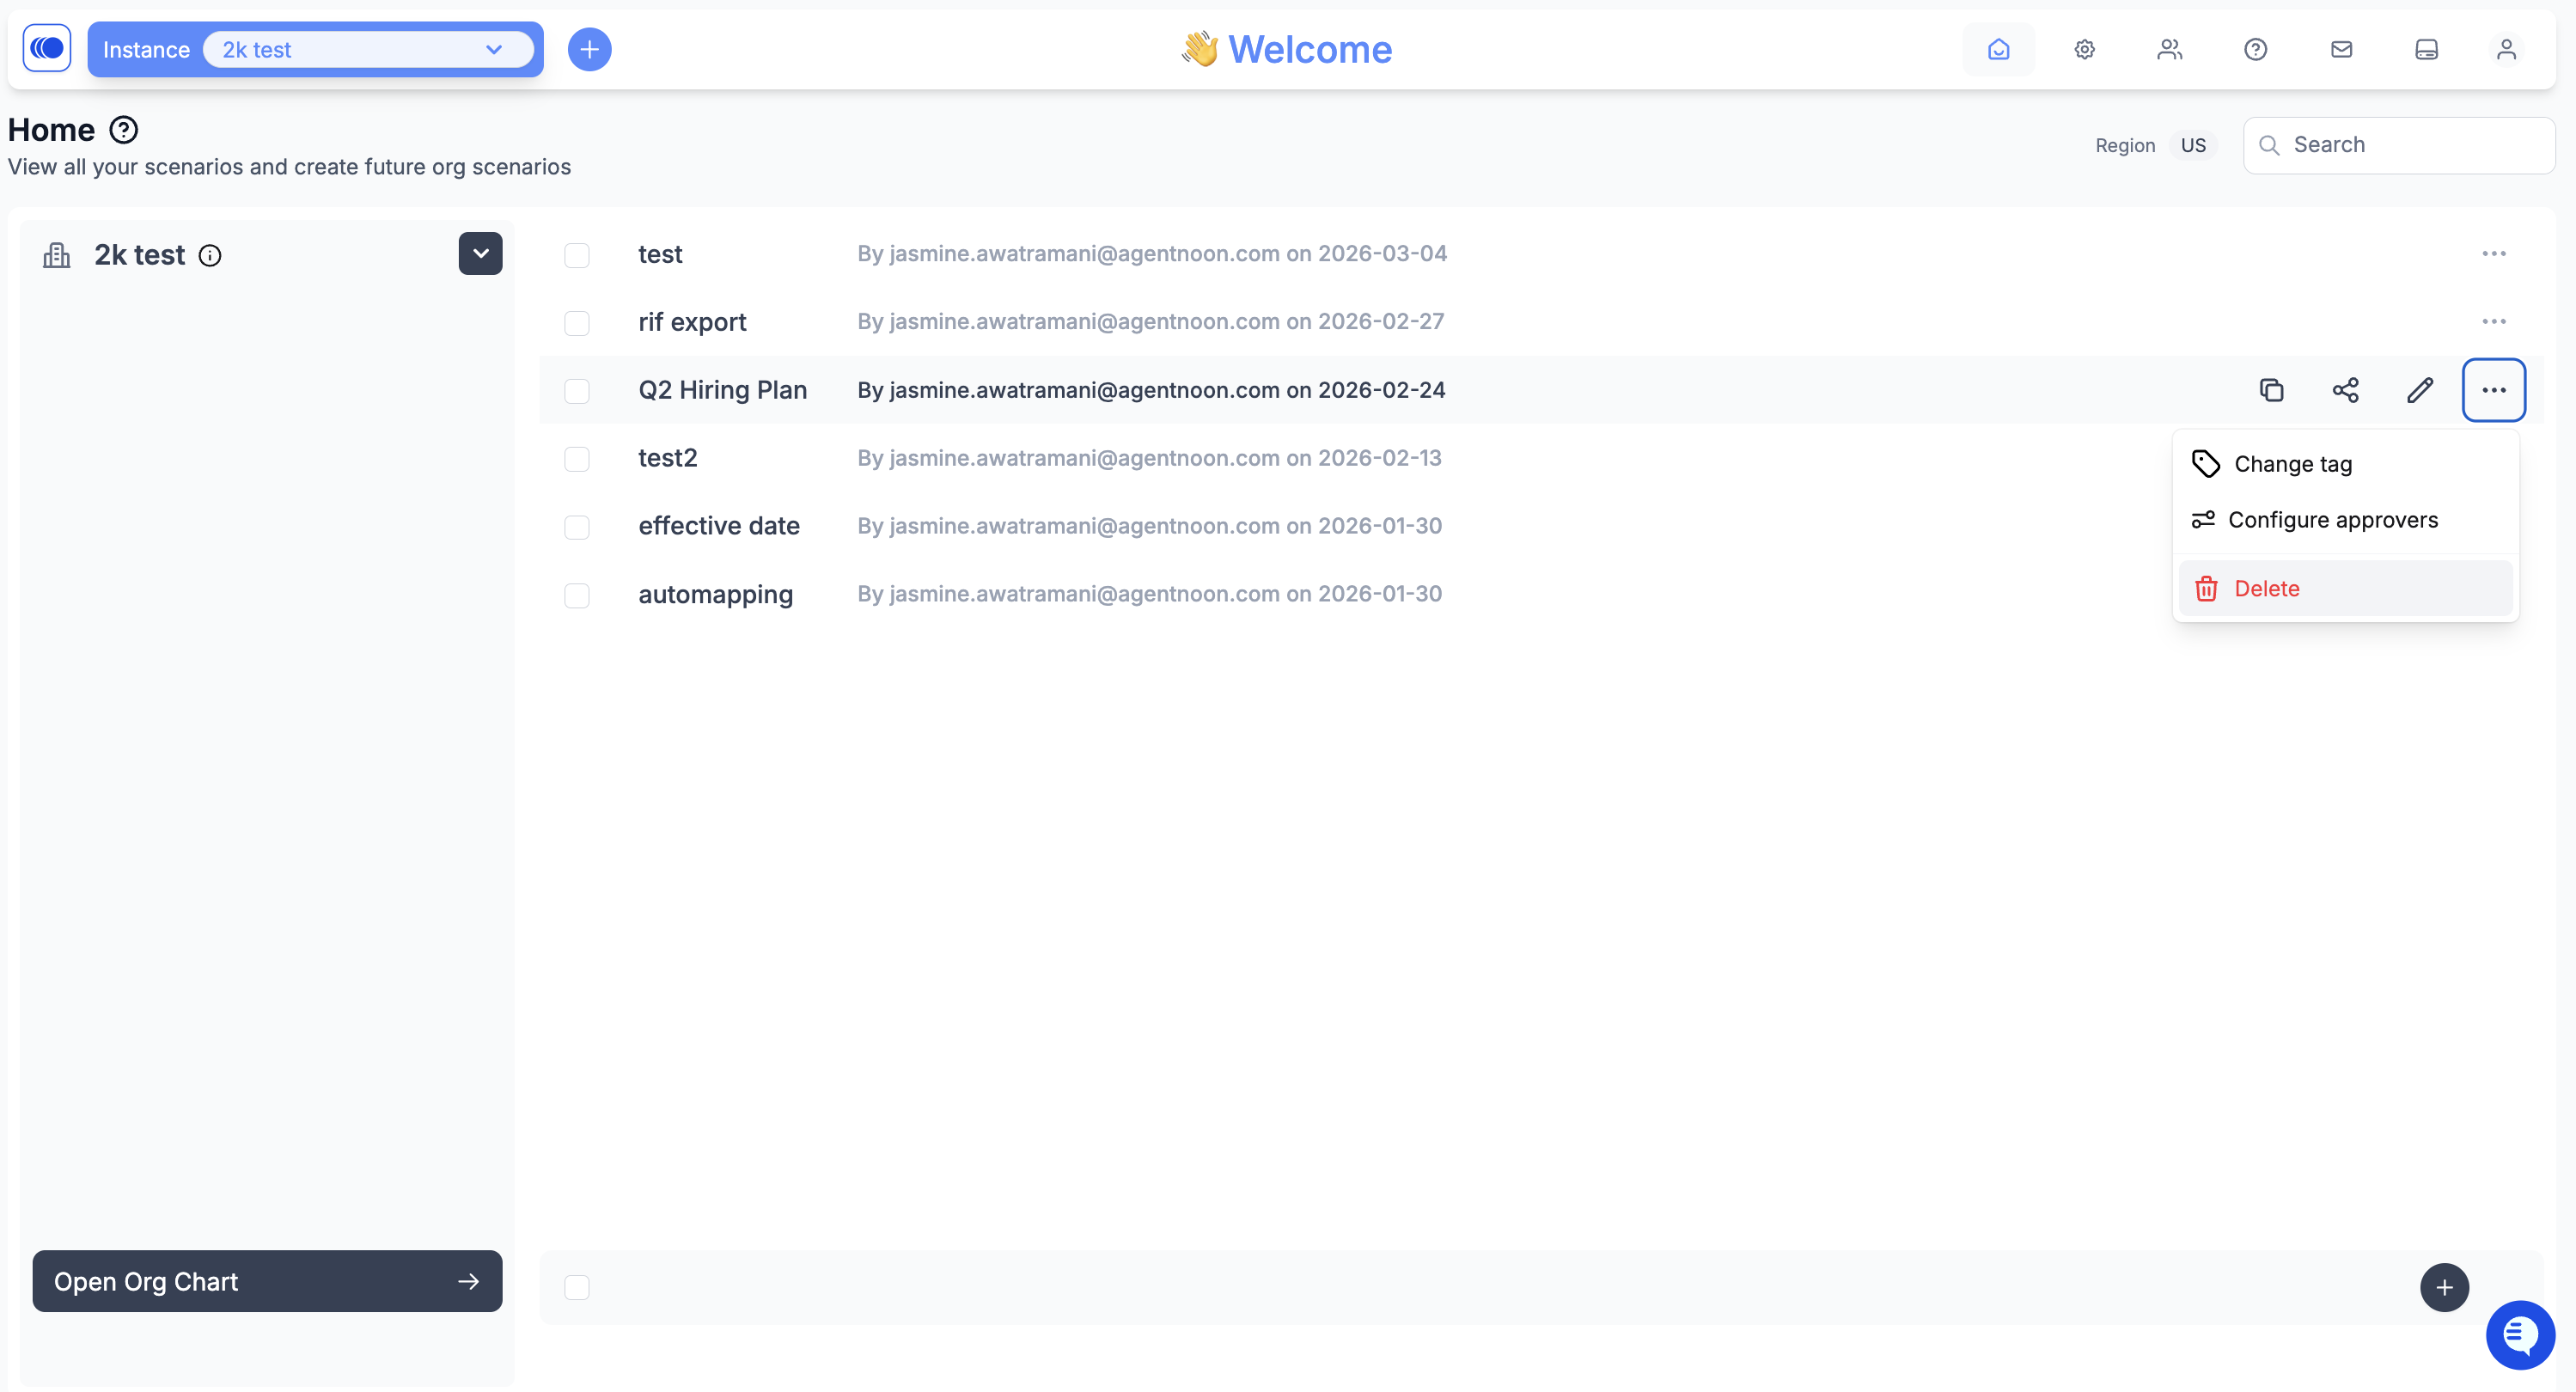
| Sync taking hours                 | Normal for >10,000 employees; contact support if unusually slow                                                                               |

**Full troubleshooting:** [Data Issues](/troubleshooting/data-issues)

## Related Resources

* [Data Import Requirements](/admin-capabilities/overview-2/data-requirements)
* [Partial Data Upload](/scenarios/advanced-actions/partial-data-upload-1)
* [Live Data Integration Overview](/technical-documentation/what-is-a-live-data-integration)
* [Data Error Checklist](/admin-capabilities/overview-2/data-error-checklist)


# Notifications

Platform notifications for approvals, invitations, and account events

Agentnoon sends notifications to keep you informed of key platform events, delivered in-app (notification bell) and by email for time-sensitive events.

## What Triggers Notifications

* **Approval requests** — When a scenario is submitted for your approval. Delivered immediately via email and in-app.
* **Approval status updates** — When a scenario you submitted is approved or rejected. Delivered immediately.
* **Invitations** — When a scenario is shared with you. Delivered immediately by email.
* **Account creation** — When a new Agentnoon account is created for you by an admin. Delivered by email with login instructions.

## What Does NOT Trigger Notifications

* Changes made inside a scenario by other collaborators
* Comments added to a scenario or position
* Presence of other users in a scenario

To coordinate on scenario changes, use the comments feature or communicate outside Agentnoon.

## Viewing Notifications

Click the notification bell in the top-right corner to see recent in-app notifications.

## Troubleshooting

| Problem                               | Solution                                                                                                                      |
| ------------------------------------- | ----------------------------------------------------------------------------------------------------------------------------- |
| Not receiving approval request emails | Check spam; verify your email address in your profile; contact admin                                                          |
| Not receiving invitation email        | Go directly to app.agentnoon.com and signup with your account - you'll get redirected to the Organization you were invited to |
| Missing approval status update        | Check the scenario's Approvals panel directly                                                                                 |


# Access Groups Examples

Practical examples of access group configurations

This page will provide practical, real-world examples of how to configure access groups for common organizational scenarios.

## Planned Content Outline

### View Budget Without Edit Access

**Use case:** Finance team needs to see compensation data for analysis but shouldn't be able to make changes.

**Configuration:**

* Access group: "Finance Analysts - View Only"
* Permissions: View all data including budget/compensation fields
* Restrictions: No edit access, no scenario creation
* Fields visible: All compensation, cost, budget fields
* Actions allowed: Export, filter, analyze
* Actions blocked: Edit positions, create scenarios, approve scenarios

### Department-Specific Access

**Use case:** Department heads should only see their own department's data.

**Configuration:**

* Access group: "Department Head - Engineering"
* Scope: Department filter = "Engineering"
* Permissions: Full edit access within Engineering only
* Can create scenarios affecting only Engineering
* Cannot see compensation data outside Engineering

### Executive View (All Data, No Restrictions)

**Use case:** C-suite needs full visibility across all data and scenarios.

**Configuration:**

* Access group: "Executives"
* Permissions: View all, edit all, approve all
* No department or field restrictions
* Can access all scenarios
* Can export all data

### HR Business Partner (Regional)

**Use case:** HRBP needs full access to specific geographic region.

**Configuration:**

* Access group: "HRBP - North America"
* Scope: Location filter = "USA, Canada, Mexico"
* Permissions: View and edit all positions in region
* Can create scenarios for region
* Can view compensation data
* Cannot approve scenarios

### External Consultant (Limited View)

**Use case:** Consultant needs to analyze org structure but shouldn't see names or compensation.

**Configuration:**

* Access group: "Consultant - Org Design"
* Permissions: View organizational structure
* Restrictions: Hide employee names, hide compensation fields
* Can view titles, departments, reporting structure
* Cannot create or edit scenarios
* Can export anonymized org charts

### Scenario Reviewer (Approval Role)

**Use case:** Manager needs to review and approve scenarios but not create them.

**Configuration:**

* Access group: "Scenario Approvers"
* Permissions: View all scenarios, approve/reject scenarios
* Can comment on scenarios
* Cannot create new scenarios
* Cannot edit positions in scenarios
* Can view change tracker and cost impact

### Read-Only Stakeholder

**Use case:** Board member needs periodic visibility without access to make changes.

**Configuration:**

* Access group: "Board - View Only"
* Permissions: View Main Org and approved scenarios
* Cannot see draft/in-progress scenarios
* Can view summary metrics and analytics
* Cannot export detailed data
* No edit or creation permissions

### Recruiter (Hiring Access)

**Use case:** Recruiting team needs to see open positions and create new positions.

**Configuration:**

* Access group: "Recruiting Team"
* Permissions: View all open/unfilled positions
* Can create new positions in scenarios
* Cannot close or modify existing filled positions
* Can see hiring budgets and compensation ranges
* Limited export permissions

## Additional Examples Needed

If you have specific access control scenarios that aren't covered above, we'd like to include them. Common scenarios we're still documenting:

* Multi-entity organizations (separate legal entities)
* Matrix organizations (dual reporting)
* Project-based access (temporary scenario access)
* Merger & acquisition access (acquired company limited access)
* Compliance/audit access (read-only with full historical data)

For immediate assistance with access control configuration, please contact <SupportSWP@dayforce.com> or refer to:

* [Access Control Overview](/admin-capabilities/overview-1)
* [Access Groups](/admin-capabilities/overview-1/access-groups)
* [Support & How to Self-Help](/start-here/support-self-help)


# Authentication & IAM

Authentication and identity security overview

This section covers authentication and identity management for Agentnoon.

## Topics

* **Multi-Factor Authentication (MFA)** - Additional security layer for user accounts
* **Single Sign-On (SSO)** - Enterprise authentication integration
* **Whitelisting** - IP and domain access controls
* **Best Practices** - Security recommendations
* **Troubleshooting** - Common authentication issues

For detailed technical documentation, see the pages in this section.


# MFA

MFA (Multi-Factor Authentication) adds an extra layer of security to your Agentnoon account by requiring users to verify their identity using a second factor in addition to your password during login

1. [In-App MFA](/technical-documentation/authentication-and-identity-security/mfa/in-app-mfa)


# In-App MFA

In-App Multi-Factor Authentication (MFA) strengthens your Agentnoon account security by verifying your identity through a one-time code sent to your registered phone number during login

#### 1. Navigate to MFA Settings

1. Click on your profile name or email address in the top-right corner of the Agentnoon app.
2. From the dropdown menu, select **Setup MFA** to begin the enrollment process.

<figure><img src="https://2094208261-files.gitbook.io/~/files/v0/b/gitbook-x-prod.appspot.com/o/spaces%2FCZc46qaaBbVmMuYXPfgz%2Fuploads%2F6xOI5UJOH9wprdlIFilN%2Fimage.png?alt=media&amp;token=d05959f3-a6a8-4695-ad47-3699f0988ac0" alt=""><figcaption></figcaption></figure>

#### 2. Register Your Phone Number

1. Enter your phone number, including the appropriate country code.
   * *Tip: You can search for your country in the dropdown and then add your number.*
2. Click **Send SMS** to receive a one-time verification code.
3. If you prefer to skip MFA setup for now, you can click **Skip**, but enabling MFA is highly recommended for your security.

<figure><img src="https://2094208261-files.gitbook.io/~/files/v0/b/gitbook-x-prod.appspot.com/o/spaces%2FCZc46qaaBbVmMuYXPfgz%2Fuploads%2Fgit-blob-c4e31c9078077e43f3fde2361512b441dc77f001%2Fimage%20(2).png?alt=media" alt="" width="563"><figcaption></figcaption></figure>

**Note:** If you have enabled in-app Multi-Factor Authentication (MFA), there is currently no way for users to disable it themselves. Please contact ***<SupportSWP@dayforce.com>*** to have it disabled on your behalf.


# Single Sign-On (SSO)

Single Sign-On (SSO) simplifies access to your Agentnoon account by allowing users to log in using their existing corporate credentials, eliminating the need to manage separate usernames and passwords

1. [Integrating Agentnoon with Okta using SAML](/technical-documentation/authentication-and-identity-security/single-sign-on-sso/integrating-agentnoon-with-okta-using-saml)
2. [Microsoft SSO Integration (Azure AD)](/technical-documentation/authentication-and-identity-security/single-sign-on-sso/microsoft-sso-integration-azure-ad)


# Integrating Agentnoon with Okta using SAML

SAML integration allows for Okta initiated sign up and login using application tile

#### 1. Create a New App Integration in Okta

1. Create a new app integration with SAML preset

<figure><img src="https://lh7-rt.googleusercontent.com/docsz/AD_4nXcfGZc8VGN9NA5ueu3qeOl085xiME9Ecwj2OGXkIOORUxSi63mR6WGW9CFwWTPDUAYB7W3MSXiLa8Vw2x--8_hWehTyCdMoIK9B7zMp-HtLwiAvH-9X3shJjSeZk7y4r0ZuRiYM5ZgO8kKd_bCeg9NyvmAh?key=gESMSun60tfjUT5xOTZlqA" alt=""><figcaption></figcaption></figure>

2. On the 1st page type in app name: Agentnoon and add a logo

#### 2. Configure SAML Settings

1. On the second page, enter the following SAML configuration:
   1. Single sign on URL
      1. <https://api-cloud.agentnoon.co/saml-sso>
   2. Audience URI:
      1. <https://app.agentnoon.com>
   3. Name ID format
      1. **EmailAddress**
   4. Attribute Statements
      1. Name: **firstName**, Value: **user.firstName**
      2. Name: **lastName**, Value: **user.lastName**

#### 3. Skip the Feedback Page

1. Click **Finish** to complete the app integration.
2. You may skip the third (feedback) page.

#### 4. Share SAML Metadata with Agentnoon

From the integration overview:

1. Go to the **Sign On** tab.
2. Click **View SAML setup instructions** (right sidebar).

<figure><img src="https://lh7-rt.googleusercontent.com/docsz/AD_4nXd2c3CfRtoUbAXf_rd36uq_JritN-ijIsUePZJ3rD3B24d-RBehb0MJWl53KZ56a0cGQJglXIEKygMHK8y4-gObEBxLcyyxwkoJ4q3vlt-kNeA94XX1AgtrYDSyTQrk-GFgrIPT3Lu_wkTvt7TU-kLj5eHt?key=gESMSun60tfjUT5xOTZlqA" alt=""><figcaption></figcaption></figure>

3. Share all 3 properties with Agentnoon:
   1. Identity Provider Single Sign-On URL
   2. Identity Provider Issuer
   3. X.509 Certificate


# Microsoft SSO Integration (Azure AD)

Agentnoon supports Single Sign-On (SSO) via Microsoft Azure Active Directory using the SAML 2.0 protocol, allowing users to securely access the platform

#### 1. Consent Link for Microsoft SSO Integration

1. Shared a link for the Customer integration with Microsoft SSO.
2. Customer’s IT Admin will need to approve the app via the consent link below
   1. Consent link: please email us at <SupportSWP@dayforce.com> and we will send over the consent link for SSO for admins
3. Other parameters the IT admin will need.
   1. Redirect URI: <https://auth.agentnoon.com/__/auth/handler>
   2. Logout URL: <https://app.agentnoon.com/logout>

#### 2. Documentation Reference

1. Reference to Microsoft Learn documentation for granting tenant-wide admin consent.
2. **Link:** [Microsoft Learn - Grant tenant-wide admin consent](https://learn.microsoft.com/en-us/entra/identity/enterprise-apps/grant-admin-consent?pivot=portal)

#### 3. Testing Account

1. We will request a test account to validate the integration setup.

#### 4. Post-Approval Actions

1. No further actions are required after the admin approval, as the configuration supports all organizational users by default.

**Action Items:**

1. Ensure the Customer’s IT Admin approves the consent link.
2. Confirm that the integration functions correctly using the provided test account.


# Google and Microsoft SSO

Securely connect your Agentnoon account using your existing Google or Microsoft credentials, simplifying login and reducing the need to manage separate passwords

Enforcing Microsoft or Google Single Sign-On (SSO) is a self-service action that can be performed directly by the user. You can validate the setup by simply logging out and then logging back in with your SSO credentials.

We have recently released a **beta self-service feature** for SSO enforcement, currently available for **Google SSO** and **Microsoft SSO** only.

#### How to Get Started

1. First, log in to Agentnoon using your Microsoft or Google SSO account.
2. Click on your profile picture in the top navigation bar, then select **Update Authentication**.

<figure><img src="https://2094208261-files.gitbook.io/~/files/v0/b/gitbook-x-prod.appspot.com/o/spaces%2FCZc46qaaBbVmMuYXPfgz%2Fuploads%2FOv4Ohfxg2YnjeDa9ai3x%2Fimage.png?alt=media&amp;token=65a3c129-861c-415b-b5a0-e69d38f27ab0" alt=""><figcaption></figcaption></figure>

3. You will be redirected to a page to authenticate with your chosen SSO provider (Google or Microsoft).

<figure><img src="https://2094208261-files.gitbook.io/~/files/v0/b/gitbook-x-prod.appspot.com/o/spaces%2FCZc46qaaBbVmMuYXPfgz%2Fuploads%2FB1ZxUdfslHAPq5Cd4mrK%2Fimage.png?alt=media&amp;token=0cd5dd70-5fc9-4547-8c31-edb66cd894a6" alt=""><figcaption></figcaption></figure>

3. Once authentication is successful, you will have the option to enforce SSO for all email addresses within your organization.

After completing these steps, SSO will be enforced for your work emails.


# Whitelisting

Whitelisting the following IP addresses and domains ensures uninterrupted and secure connectivity between Agentnoon services and your systems

* **Required**
  * [app.agentnoon.com](https://app.agentnoon.com)
  * \*.[firebaseapp.com](http://firebaseapp.com/)
  * \*.[googleapis.com](http://googleapis.com/)
  * \*.[gstatic.com](http://gstatic.com/)
  * [apis.google.com](http://apis.google.com/)
  * [firebaseapp.com](http://firebaseapp.com/)
  * [firestore.googleapis.com](http://firestore.googleapis.com/)
  * [fonts.googleapis.com](http://fonts.googleapis.com/)
  * [fonts.gstatic.com](http://fonts.gstatic.com/)
  * [google.com](http://google.com/)
  * [gstatic.com](http://gstatic.com/)
  * [identitytoolkit.googleapis.com](http://identitytoolkit.googleapis.com/)
  * [www.google.com](http://www.google.com/)
  * [www.googleapis.com](http://www.googleapis.com/)
  * [www.gstatic.com](http://www.gstatic.com/)
  * \*.[agentnoon.co](http://agentnoon.co/)
  * [auth.agentnoon.com](http://auth.agentnoon.com/)
  * [app.agentnoon.com](http://app.agentnoon.com/)
  * [safebrowsing.googleapis.com](http://safebrowsing.googleapis.com/)
  * [securetoken.googleapis.com](http://securetoken.googleapis.com/)
  * [ip2c.org](http://ip2c.org/)
* **Monitoring (*****Preferred*****)**
  * [grafana.agentnoon.com](https://grafana.agentnoon.com)
  * \*.[ingest.sentry.io](http://ingest.sentry.io/)
  * \*.[mxpnl.com](http://mxpnl.com/)
  * [mxpnl.com](http://mxpnl.com/)
  * [Ih3.googleusercontent.com](http://ih3.googleusercontent.com/)
* **User Support**
  * [avatars.usepylon.com](http://avatars.usepylon.com/)
  * [widget.usepylon.com](http://widget.usepylon.com/)
  * [help.agentnoon.com](http://help.agentnoon.com/)
* **Authentication (*****Not needed if using password authentication*****)**
  * [aadcdn.msauth.net](http://aadcdn.msauth.net/)
  * [eu-mobile.events.data.microsoft.com](http://eu-mobile.events.data.microsoft.com/)
  * [aadcdn.msauthimages.net](http://aadcdn.msauthimages.net/)
  * [login.live.com](http://login.live.com/)
  * [login.microsoftonline.com](http://login.microsoftonline.com/)


# Data Security & Privacy

Data security, privacy, and compliance

Agentnoon is committed to protecting your organizational data with industry-leading security practices, compliance certifications, and transparent privacy policies.

## Security Certifications & Compliance

Agentnoon maintains rigorous security standards and complies with major data protection regulations:

### Compliance Certifications

**SOC 2 Compliant**

* Independent third-party audit of security controls
* Validates security, availability, and confidentiality
* Annual audits ensure continued compliance

**GDPR Compliant**

* Full compliance with EU General Data Protection Regulation
* Data subject rights fully supported
* Privacy by design and by default

**ISO 27001 Certified**

* International standard for information security management
* Systematic approach to managing sensitive data
* Regular audits and continuous improvement

## Data Encryption

Agentnoon protects your data using industry-standard encryption at every stage.

### Encryption at Rest

**All data encrypted at rest:**

* Customer data stored with industry-standard encryption
* Database encryption enabled
* File storage encrypted
* Backup data encrypted

### Encryption in Transit

**All data encrypted in transit:**

* TLS 1.2+ encryption for all connections
* HTTPS enforced across the platform
* Secure API communications
* Encrypted data transfers during integrations

**Encryption standards:**

* Industry-standard encryption algorithms
* Regular security updates and patches
* Cryptographic key management best practices

## Access Controls & Authentication

Agentnoon provides robust access controls to ensure only authorized users can access your data.

### Authentication Options

**Single Sign-On (SSO):**

* SAML 2.0 support
* Integration with Okta, Azure AD, Google Workspace
* Centralized identity management

**Multi-Factor Authentication (MFA):**

* Optional MFA for additional security
* Reduces risk of unauthorized access
* Support for authenticator apps

### Access Management

**Role-Based Access Control (RBAC):**

* Admin, user, and custom roles
* Granular permissions per role
* Field-level access controls

**Access Groups:**

* Scope access by department, location, or custom attributes
* Control who can view, edit, or export data
* Flexible permission configurations

### Session Management

**Automatic session security:**

* Auto-timeout after period of inactivity
* Secure session handling
* Session invalidation on logout

## Audit Logging

Agentnoon tracks user activity to maintain security and accountability.

**What is logged:**

* User login and logout events
* Data access (who viewed what)
* Data modifications (who changed what)
* Export activities
* Admin actions
* Permission changes

**Audit log features:**

* Timestamps for all events
* User identification
* Action details
* Available to administrators

**Use cases:**

* Security investigations
* Compliance audits
* Troubleshooting access issues
* Understanding data changes

## Data Privacy

### Data Ownership

**Your data is yours:**

* You own your organizational data
* Agentnoon processes data on your behalf
* You control who accesses your data
* You can export or delete your data at any time

### Data Retention Policy

**Data lifecycle:**

* Data retained while your account is active
* Data retained for **30 days after account termination**
* After 30 days, all customer data is permanently deleted
* Backups purged after retention period

### Right to Deletion (GDPR)

**Data deletion supported:**

* Customers can request data deletion at any time
* Data removed within 30 days of termination
* Permanent deletion of all customer data
* Confirmation provided upon completion

### Data Export for Compliance

**Export your data anytime:**

* Export organizational data to CSV or Excel
* Export user lists and permissions
* Export audit logs
* Self-service export via platform
* API access for automated exports

## Infrastructure & Data Residency

### Cloud Platform

**Agentnoon:**

* Hosted on **Google Cloud Platform (GCP)**
* Enterprise-grade infrastructure
* 99.9%+ uptime SLA
* Automated backups and disaster recovery

**Dayforce SWP:**

* Hosted on **Microsoft Azure**
* Redundant infrastructure
* High availability and performance

### Data Residency Options

**Global infrastructure:**

Agentnoon offers data residency in multiple regions to support data sovereignty requirements:

* **United States** (US)
* **European Union** (EU)
* **Australia** (AUS)
* **United Arab Emirates** (UAE)

**Benefits:**

* Comply with local data protection laws
* Reduce latency for global teams
* Meet data residency requirements

**Note:** Contact your account manager to configure data residency for your organization.

## Security Best Practices for Users

To maximize security, we recommend:

### For Administrators

1. **Enable SSO** - Centralize identity management
2. **Require MFA** - Add extra layer of security
3. **Configure access groups** - Limit access to need-to-know basis
4. **Review audit logs regularly** - Monitor for unusual activity
5. **Limit admin permissions** - Only assign admin role when necessary
6. **Use strong passwords** - If not using SSO, enforce password policies

### For All Users

1. **Use strong, unique passwords** - Never reuse passwords
2. **Enable MFA on your account** - If available
3. **Log out after sessions** - Especially on shared computers
4. **Don't share credentials** - Each user should have their own account
5. **Report suspicious activity** - Contact admin or support immediately
6. **Be cautious with exports** - Exported data contains sensitive information

## Third-Party Security

### Integrations

**Security for data integrations:**

* Encrypted connections to HRIS systems (Workday, BambooHR, ADP)
* Secure SFTP transfers
* API authentication and authorization
* Regular security reviews of integration partners

### Vendors & Subprocessors

**Agentnoon's vendor management:**

* Security assessment of all vendors
* Data Processing Agreements (DPAs) in place
* Regular vendor security reviews
* Compliance with GDPR Article 28 (processor requirements)

## Vulnerability Management

**Proactive security:**

* Regular security assessments and penetration testing
* Vulnerability scanning and remediation
* Security patch management
* Bug bounty program (if applicable)

**Responsible disclosure:**

* Security researchers can report vulnerabilities
* Coordinated disclosure process
* Timely patches for identified issues

## Incident Response

### Security Incident Procedures

In the event of a security incident:

1. **Detection** - Security monitoring and alerting
2. **Assessment** - Evaluate scope and impact
3. **Containment** - Stop the incident from spreading
4. **Resolution** - Remediate the root cause
5. **Notification** - Communicate to affected customers
6. **Post-mortem** - Learn and improve

### Breach Notification

**Transparency commitment:**

* Notify affected customers promptly
* Provide details on incident scope and impact
* Explain remediation steps taken
* Comply with GDPR breach notification requirements (72 hours)

## Reporting Security Concerns

If you discover a security vulnerability or have security concerns:

**Contact:** <SupportSWP@dayforce.com>

**Include:**

* Description of the issue
* Steps to reproduce (if applicable)
* Potential impact
* Your contact information

**Response time:** We aim to respond to security reports within 24-48 hours.

## Frequently Asked Questions

### Is my data encrypted?

Yes, all data is encrypted both at rest (in storage) and in transit (during transmission).

### Can I choose where my data is stored?

Yes, Agentnoon offers data residency in US, EU, Australia, and UAE regions. Contact your account manager to configure.

### What happens to my data if I cancel my account?

Data is retained for 30 days after account termination, then permanently deleted.

### Can I export all my data?

Yes, you can export your organizational data, user lists, and audit logs at any time via the platform or API.

### Is Agentnoon GDPR compliant?

Yes, Agentnoon is fully GDPR compliant and supports all data subject rights.

### Do you have SOC 2?

Yes, Agentnoon is SOC 2 compliant with annual audits.

### Can I get a copy of your security certifications?

Yes, contact your account manager or <SupportSWP@dayforce.com> to request security documentation.

## Additional Resources

* [Authentication & IAM](/technical-documentation/authentication-and-identity-security) - SSO and MFA setup
* [Access Control Overview](/admin-capabilities/overview-1) - Managing user permissions
* [Data Management](/admin-capabilities/overview-2) - Secure data import practices
* [Support & How to Self-Help](/start-here/support-self-help) - General support resources

**Last updated:** February 2026 **Security documentation version:** 1.0


# Data Transformation Hub

Add enrichment data on top of your automated integration

The Data Transformation Hub lets admins add additional data on top of an existing automated integration.

This is useful when your main HRIS or automated source does not include all the data you want to analyze in Agentnoon. For example, you may want to enrich your workforce data with:

* Performance data
* Planning data
* Custom attributes
* Data exported from another system

This feature was introduced as part of the Data Transformation API and subsequent improvements to the enrichment workflow. Recent releases also added clearer enrich-and-import flows and support for enrichment data in import pipelines.

### What this Feature Does

Data Transformation Hub allows you to:

* Upload a CSV enrichment file
* Join it to your existing automated integration
* Add new columns to your Agentnoon dataset
* Keep those columns in sync going forward

Once configured, the enrichment step runs alongside your automated data flow, so you do not need to manually rebuild the full process every time.

### When to Use Enrichment Data <a href="#wopj02q3c8i6" id="wopj02q3c8i6"></a>

Use enrichment data when:

* Your automated integration is missing fields you need
* You want to combine HRIS data with another flat file
* You want to add custom attributes that do not exist in your main source
* You want to enrich workforce data using a shared unique identifier such as:
  * Employee ID
  * Position ID
  * Email
  * Another stable unique key

Example:\
&#x20;Your HRIS integration brings in core employee data, but you also want to add:

* New Performance
* New Data
* New Attribute

You can upload those extra columns in an enrichment file and merge them into your main dataset using Employee ID.

### Before You Start <a href="#lxb6okjbf75j" id="lxb6okjbf75j"></a>

Make sure you have:

* An automated integration already set up
* A CSV file containing the additional data
* A join column that exists in both datasets

Your enrichment file should include:

* One column that matches a unique field in your main data
* One or more new columns you want to add

Example:

<table data-header-hidden><thead><tr><th valign="top"></th><th valign="top"></th><th valign="top"></th><th valign="top"></th></tr></thead><tbody><tr><td valign="top">Employee ID</td><td valign="top">New Performance</td><td valign="top">New Data</td><td valign="top">New Attribute</td></tr><tr><td valign="top">1001</td><td valign="top">High Performer</td><td valign="top">A</td><td valign="top">Internal</td></tr><tr><td valign="top">1002</td><td valign="top">Solid Performer</td><td valign="top">B</td><td valign="top">External</td></tr></tbody></table>

### How to Add Enrichment Data <a href="#o5dbo4s4a887" id="o5dbo4s4a887"></a>

#### Step 1: Open Data Transformation Hub <a href="#gso6zhsq8r65" id="gso6zhsq8r65"></a>

1. Go to the Home page
2. Open Settings
3. Go to Data Management
4. Open Data Transformation Hub
5. Click Open Hub

#### Step 2: Start a New Enrichment Upload <a href="#xmcsdc5uf8hx" id="xmcsdc5uf8hx"></a>

1. Click Add or Update Enrichment Data
2. Upload your enrichment file
3. Make sure the file is in CSV format (UTF-8 Encoding)

#### Step 3: Choose the Merge Type <a href="#o9x6wpf52qds" id="o9x6wpf52qds"></a>

You will see merge options for how the enrichment file should be combined with your main data.

**Left Join to Main Data**

Recommended in most cases.

This keeps:

* All rows from your main dataset
* Matching rows from your enrichment file

Use this when you want to preserve your full organization while adding extra fields where matches exist.

**Enriching / common records only**

This only keeps records that exist in both datasets.

Use this only if you are sure your enrichment file contains the full population you want to work with. In most cases, Left Join to Main Data is the safer option.

#### Step 4: Select the join columns <a href="#lo1irk2a8zow" id="lo1irk2a8zow"></a>

Choose:

* The Main Data Join Column
* The Enrichment Join Column

These columns should contain the same identifier.

Examples:

* Employee ID ↔ Employee ID
* Position ID ↔ Position ID
* Email ↔ Email

Agentnoon will use these fields to match rows between your main data and your enrichment file.

#### Step 5: Review the Transformation <a href="#id-5hdxyfthlktq" id="id-5hdxyfthlktq"></a>

After mapping the join columns, click Next.

You’ll see a preview of:

* Your main dataset
* The enrichment file
* The new columns that will be added

Review the output carefully before processing.

#### Step 6: Process the Data <a href="#rw81tmbrl4ms" id="rw81tmbrl4ms"></a>

Click Process Data.

After processing:

* Download the processed file
* This file now includes your original data plus the new enrichment columns

#### Step 7: Upload the Processed Dataset Once <a href="#fysqcico550" id="fysqcico550"></a>

To make the new columns available in Agentnoon:

1. Go to Upload Entire Data Set
2. Choose the CSV upload option
3. Upload the processed file you just downloaded

On the mapping screen:

* Your previous mappings should remain saved
* Select the new fields you are bringing in
* Finish the upload

You only need to do this initial mapping once for new columns.

### What Happens After Setup <a href="#t0ib9mve4r39" id="t0ib9mve4r39"></a>

Once the enrichment file is configured and the new columns are mapped:

* The new fields become available in Agentnoon
* You can access them in places like card content and analysis views
* Your automated integration remains intact
* On future syncs, the enrichment logic continues to run automatically

This means you do not need to rebuild your setup every time your automated integration refreshes.

### Updating an existing enrichment file <a href="#hdkqbgjhky9o" id="hdkqbgjhky9o"></a>

If you want to update the values in your enrichment file later:

1. Return to Data Transformation Hub
2. Open Add or Update Enrichment Data
3. Upload the updated CSV
4. Process it again

If the column structure is unchanged:

* You usually do not need to remap the fields again
* The existing mapped fields will continue to work

If you add brand new columns:

* You will need to upload the processed dataset once again
* Then map the new fields in the CSV upload flow

### Best Practices <a href="#id-82ig3xa9g0e" id="id-82ig3xa9g0e"></a>

#### Use a Stable Join Key <a href="#jpn6bw4kud8" id="jpn6bw4kud8"></a>

Use a field that does not change often, such as:

* Employee ID
* Position ID

Avoid joining on fields like name where duplicates or formatting differences may exist.

#### Prefer Left Join to Main Data <a href="#iu91o6j0yrac" id="iu91o6j0yrac"></a>

This keeps your full org intact and prevents accidental loss of unmatched rows.

#### Keep enrichment files clean <a href="#id-5vqhakg4ansi" id="id-5vqhakg4ansi"></a>

Before upload:

* Remove duplicates
* Confirm identifiers match formatting in your main data
* ,ake sure CSV headers are final

#### Add only Useful Fields <a href="#id-8zk3jwhs6ajc" id="id-8zk3jwhs6ajc"></a>

Only bring in columns you plan to use in Agentnoon. This keeps your setup clean and easier to manage.

### Limitations <a href="#oge1xesw9zau" id="oge1xesw9zau"></a>

* Enrichment files must be uploaded in CSV format
* You need a matching join column in both datasets
* New columns must be mapped once before they become available in the product
* If your enrichment file does not contain all rows from your main data, using the wrong merge type can lead to incomplete output

### Common workflow example <a href="#lwcjiflmikh5" id="lwcjiflmikh5"></a>

#### Add Performance Data to an Automated Integration <a href="#id-6qg166v8zeoj" id="id-6qg166v8zeoj"></a>

1. Your HRIS integration already brings in workforce data
2. You export a flat file containing:
   1. Employee ID
   2. Performance
   3. Potential
3. You upload that flat file into Data Transformation Hub
4. You join on Employee ID
5. You process and upload the enriched dataset once
6. Performance and Potential now become available in Agentnoon
7. Future syncs continue using the same enrichment logic

### Troubleshooting <a href="#cffce2tafz9j" id="cffce2tafz9j"></a>

#### My new fields are not visible in Agentnoon <a href="#id-34mjfrw9rjo0" id="id-34mjfrw9rjo0"></a>

Check that:

* The processed dataset was uploaded
* The new columns were selected during CSV mapping
* The join column matched correctly

#### My data looks incomplete after processing <a href="#id-9z64t3jxnuju" id="id-9z64t3jxnuju"></a>

Check whether you selected:

* Left Join to Main Data instead of a common-records-only enrichment mode

#### My enrichment file updated, but values did not change <a href="#jsm812yfnsw2" id="jsm812yfnsw2"></a>

Re-upload the updated file through Data Transformation Hub and process it again.


---

[Next Page](/llms-full.txt/1)