- Agentnoon Help Center
- Org Visualization / Org Chart
- Org Chart Views
Views Summary
You can change how you view the org chart depending on your use case.
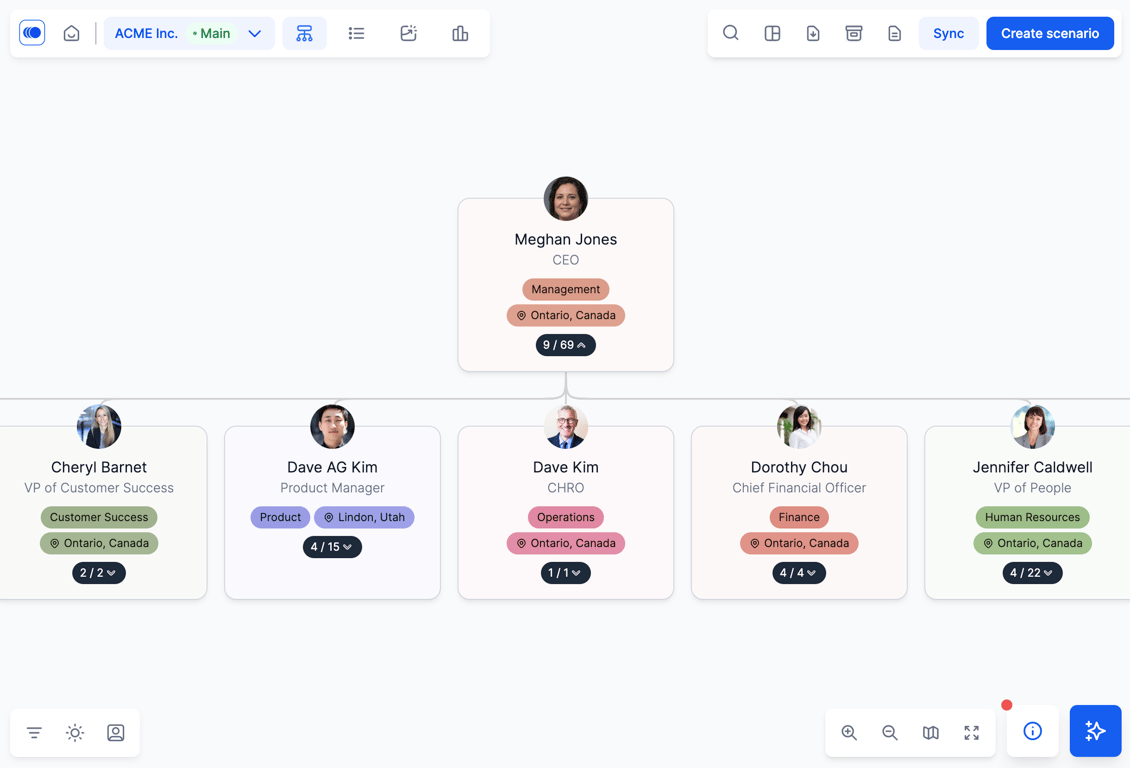
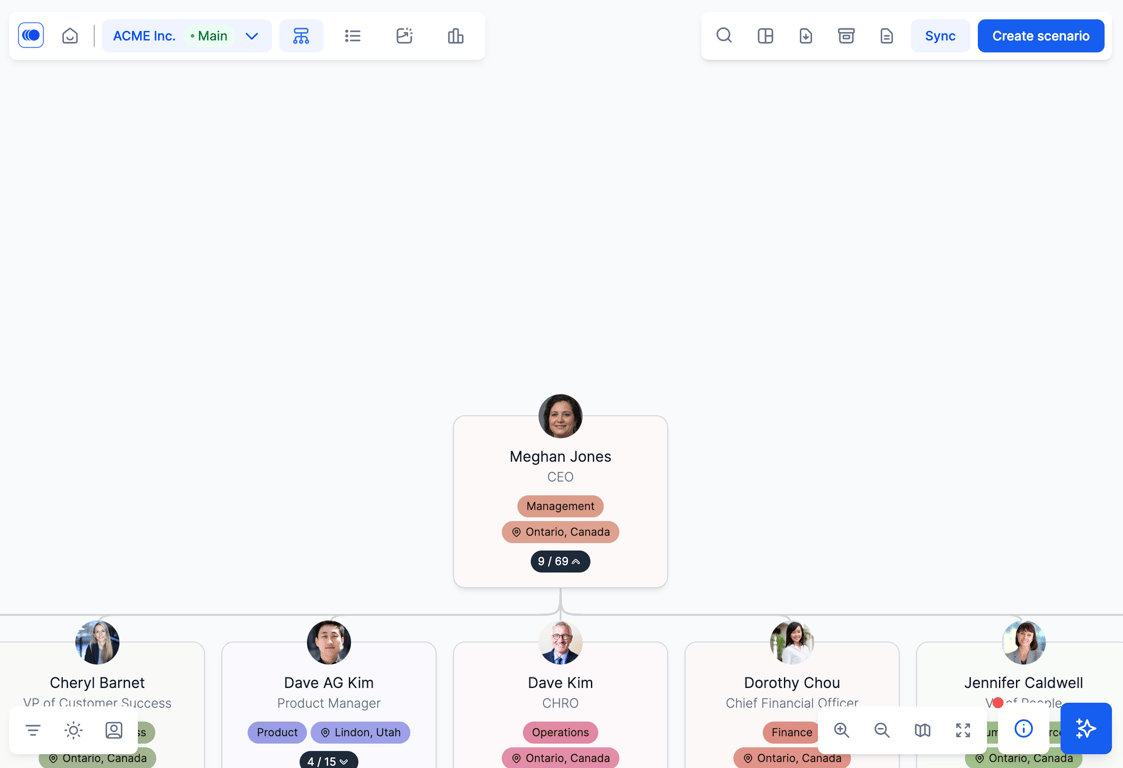
This is the normal org chart where you can drill down into specific team or individuals by clicking the black arrow button.
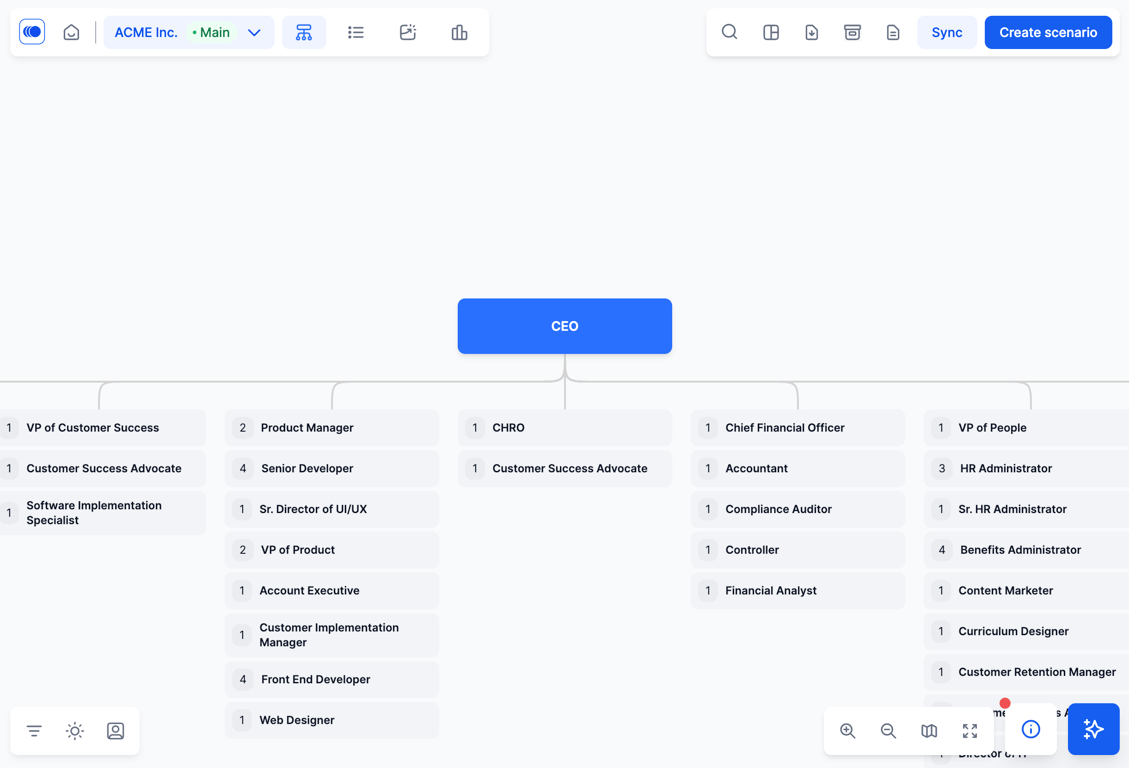
You can change into role-based org charts and show hierarchy based on roles.
If you have dotted line data, you can visualize dotted line data in the org chart too.
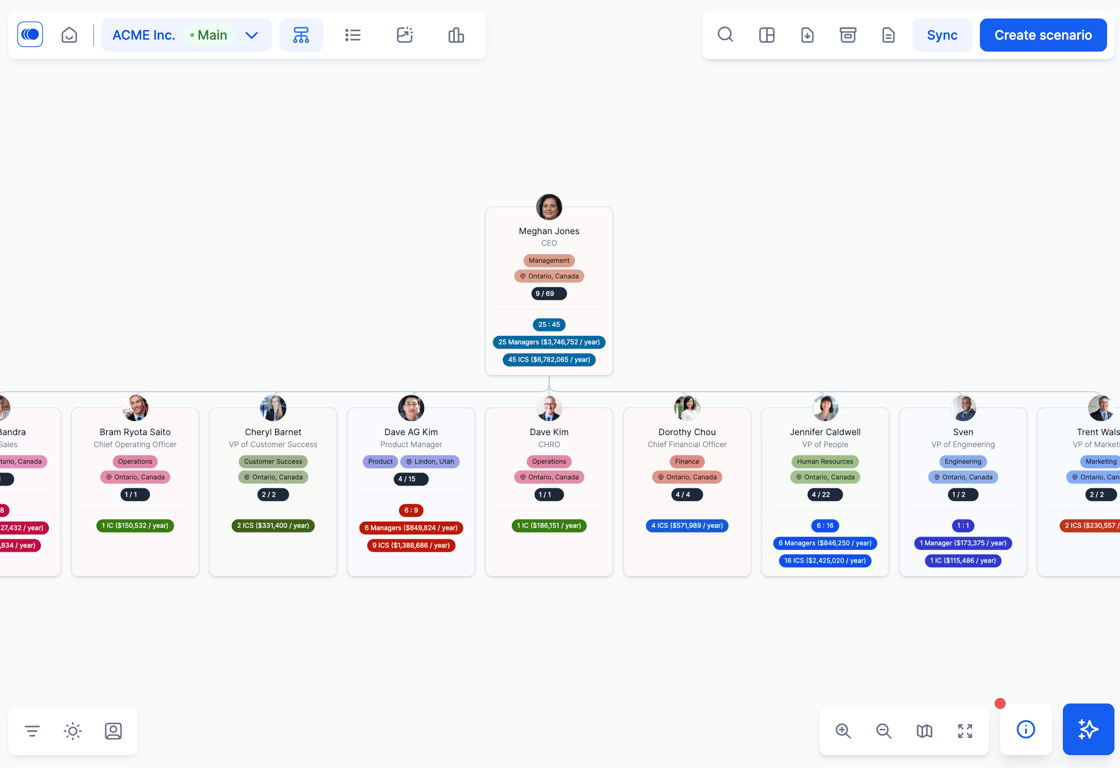
There's an executive view where we show how many managers, C-level managers and individual contributors there are. You can also show the headcount costs for each department.
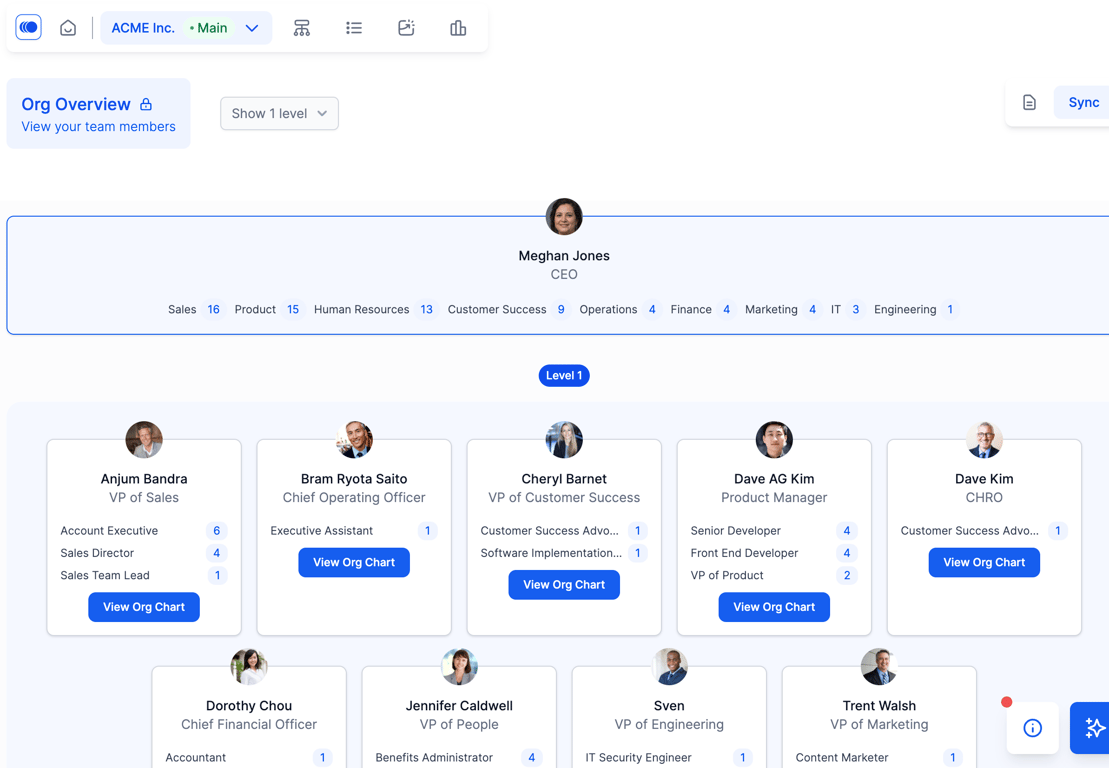
The overview function shows number of people in each department, how many different roles in each department there are, etc.
The manager view is similar to the executive overview but you can break it down by each manager -- how many managers are in that team, how many ICs there are in each team and what the cost associations are.