How to use our hub feature to visualize your org dynamics and understand your organizational structure better.
You can get to the hub by typing 4 or hitting the rightmost button on the top navigation bar.
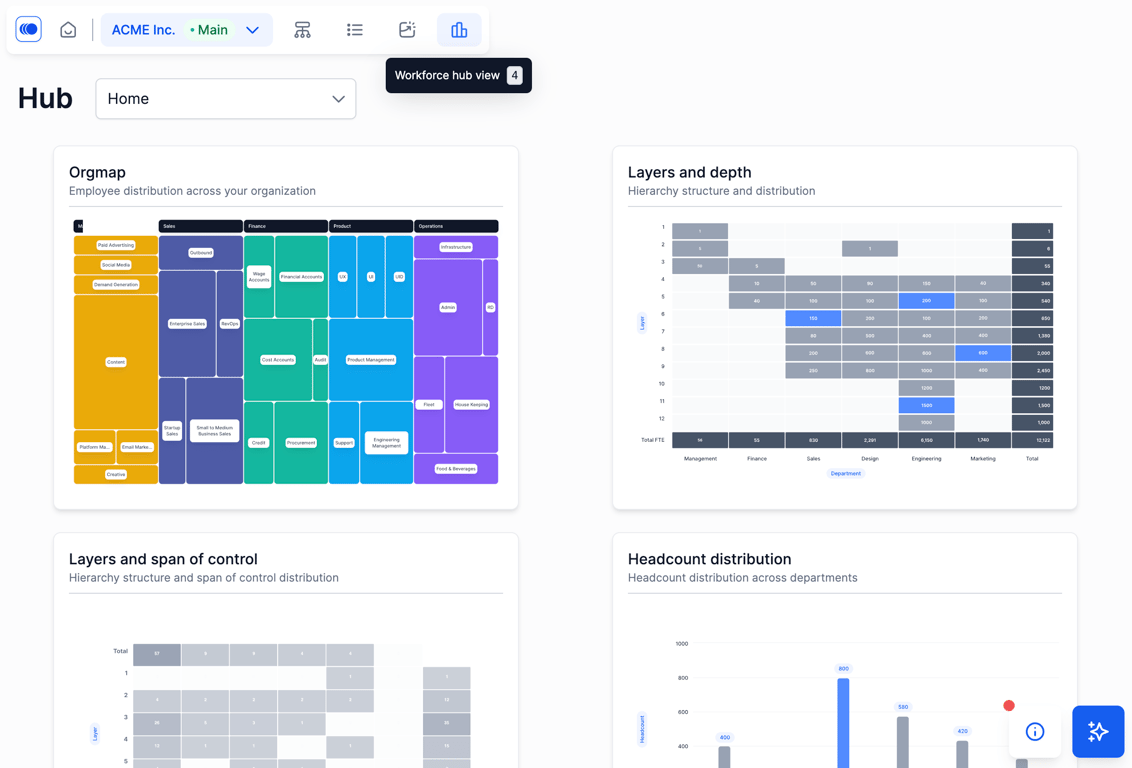
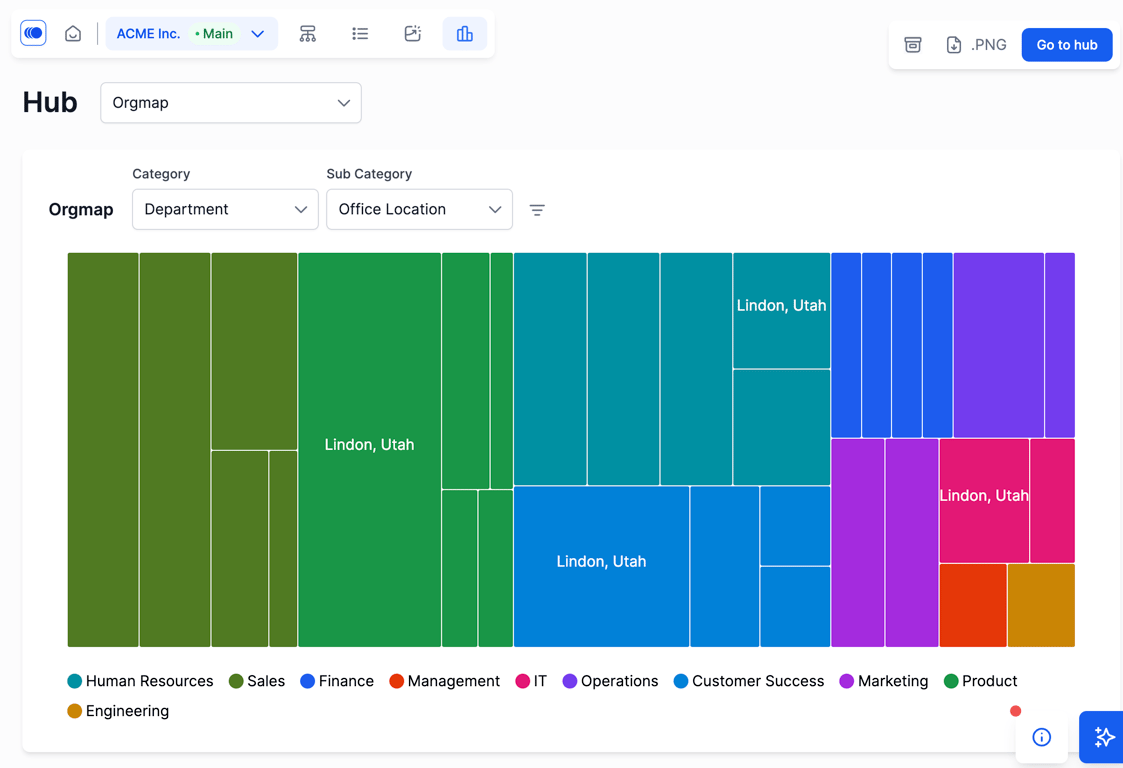
The first is a org map, a block style distribution of your workforce. The size of the rectangle here is determined by how many people you have and then the split of these rectangles is based on these categories and subcategories. We're pretty flexible with the kinds of drop downs you have and it depends on the fields that you import into the system. You can change the categories and subcategories.
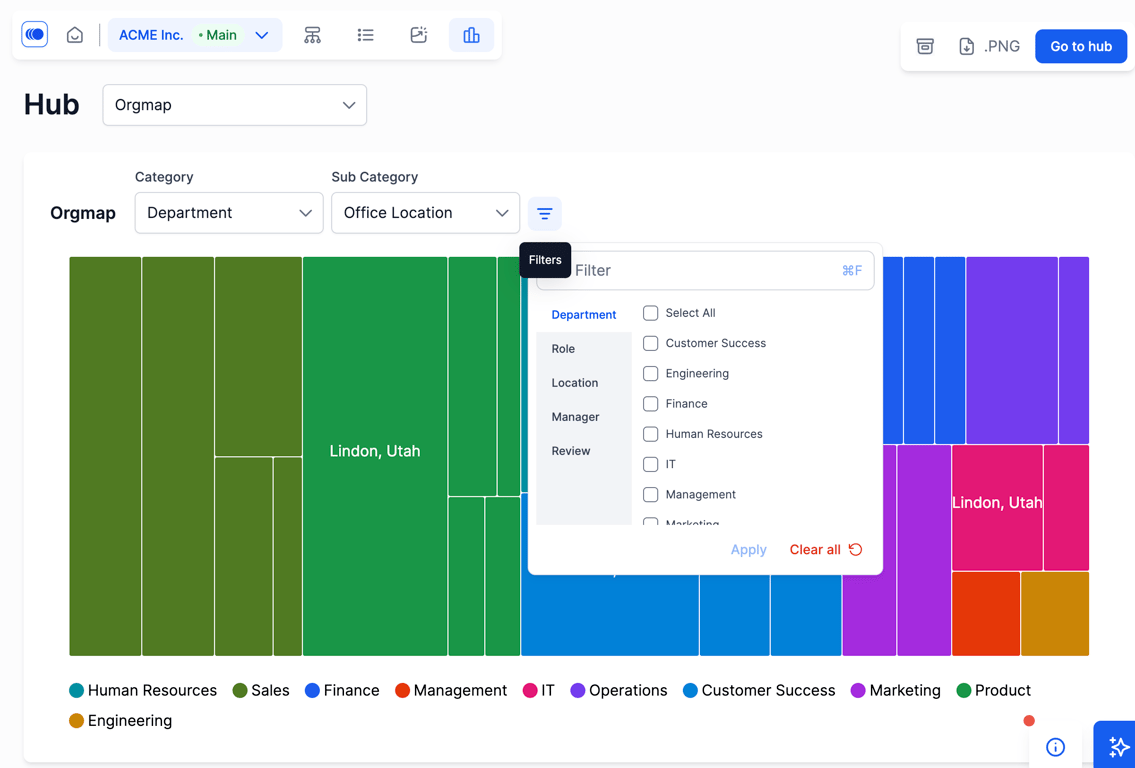
Filters are available on every chart so you can view any kind of chart for specific people.
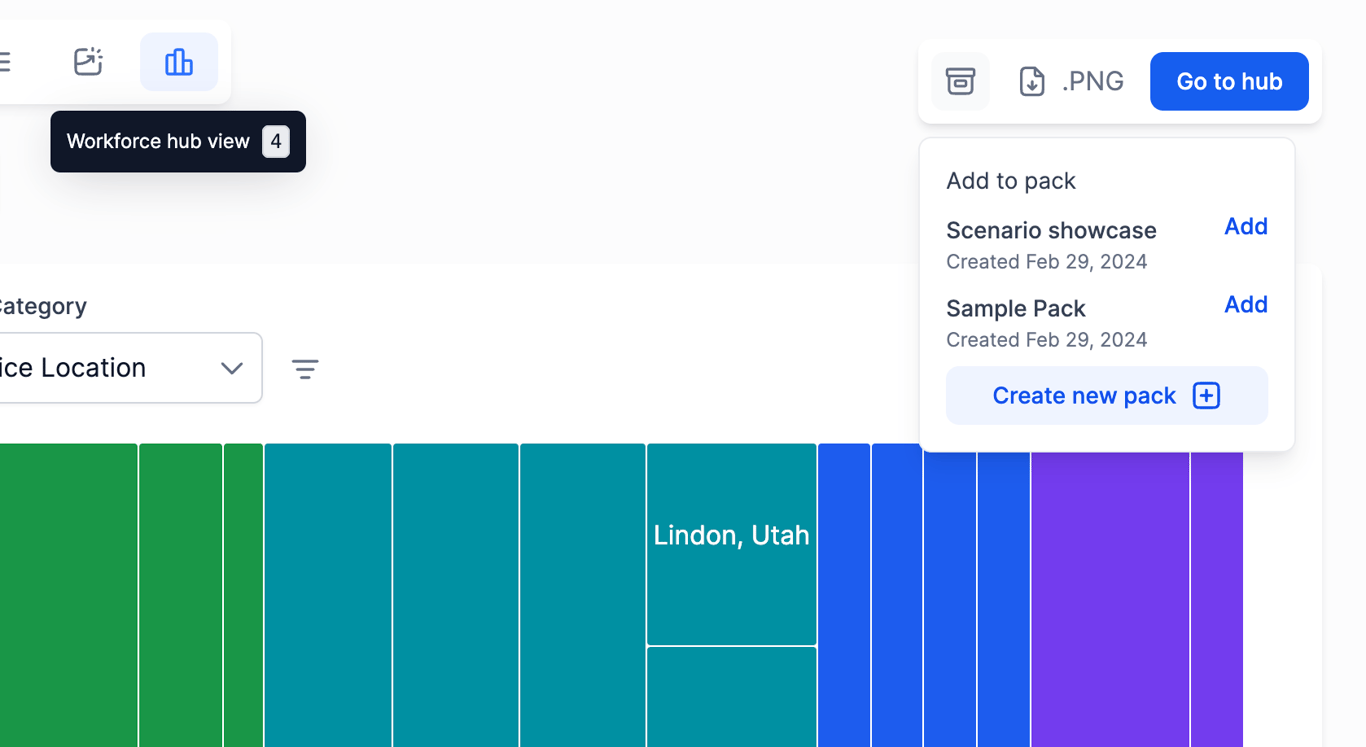
You can export options for Powerpoint and image -- for Powerpoint you can add them to a slide back and order the way you want. For images, you can have a one time image download in low or high res.
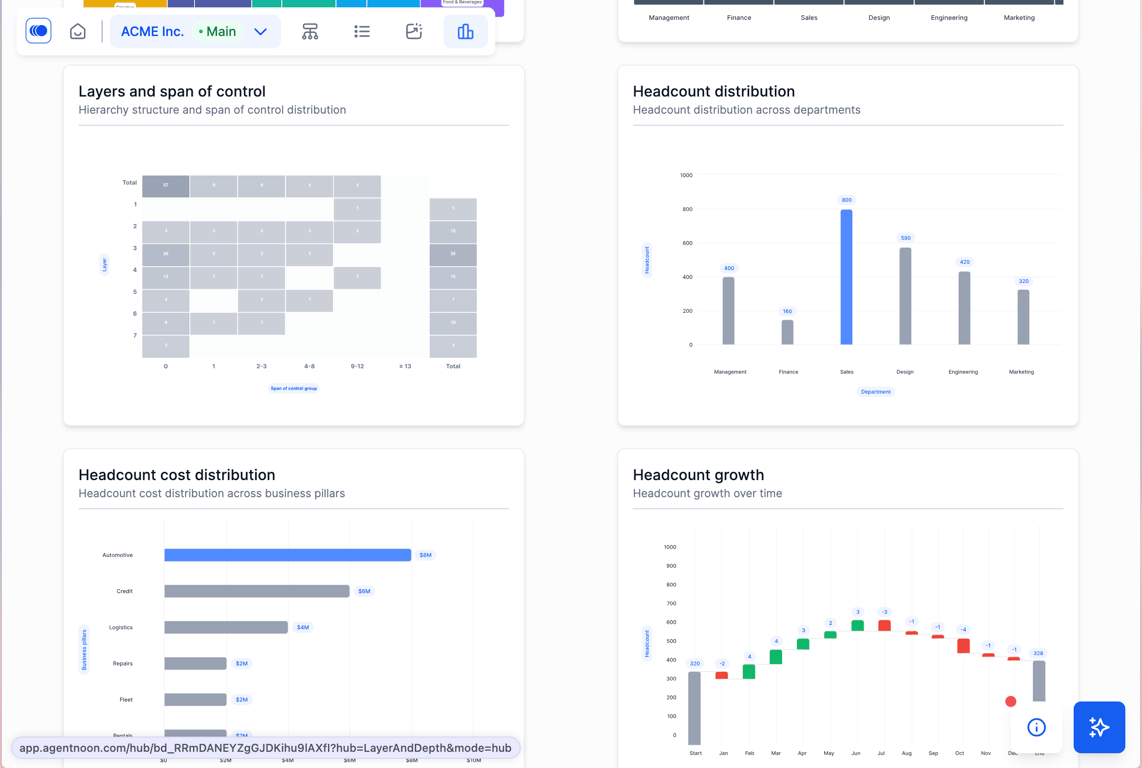
A couple other charts are layers and depth which tells you headcount by different levels, different grades, and layers in your org. We have cost charts which show you headcount cost distribution, headcount growth or cost changes over time, and the last piece is activity charts -- what tasks people are working on, how much time are they spending on it and effort associated with different activities.
These come standard and we do customize for our customers upon request.