- Agentnoon Help Center
- Data Management
- Integrations
Incorporating sales data
Add sales data into your org chart to filter, add to card content, and easily see who is above or under quota at any given time.
-
You can add a data source — in this case, we have a demo Google Sheet of employee implementation, with sales quotas in one of the columns.
-
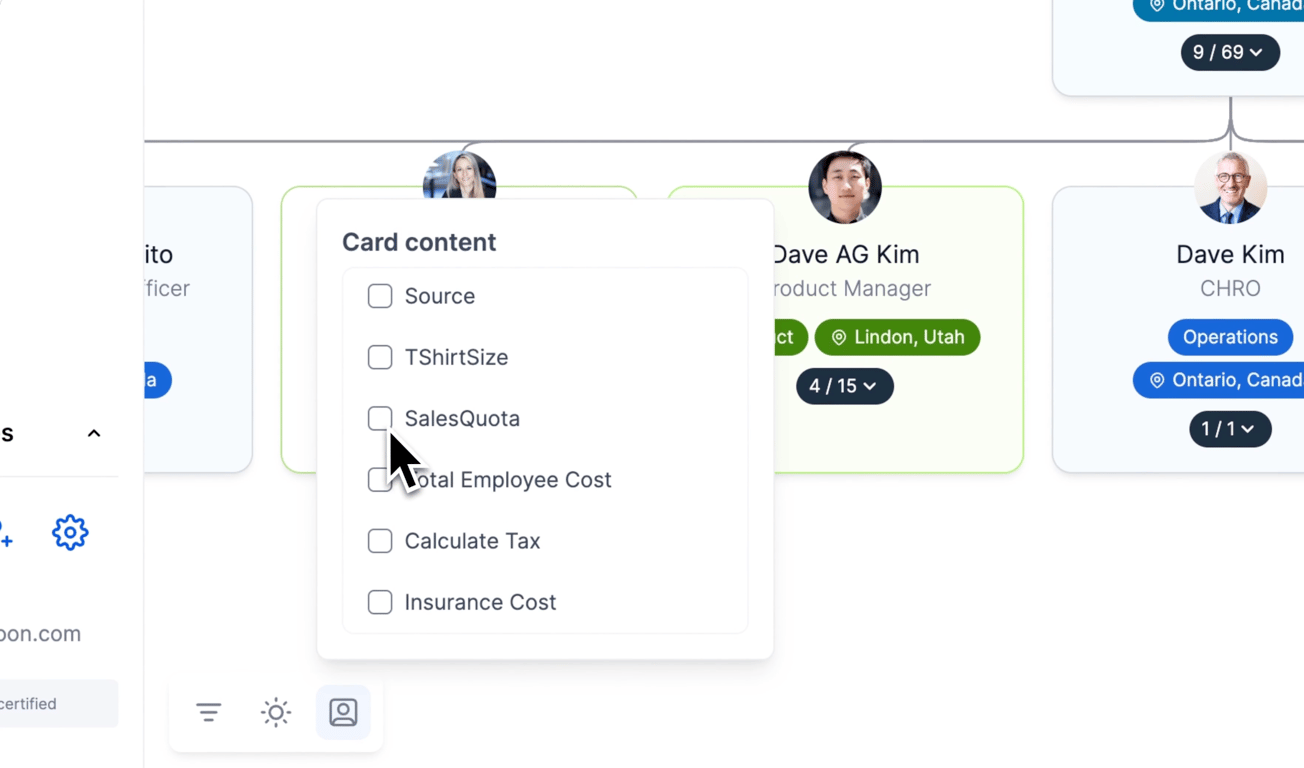
In my org chart, I can click the person icon in the bottom left of the screen and select “SalesQuota” in the Card Content menu to add sales quota to each card.
-
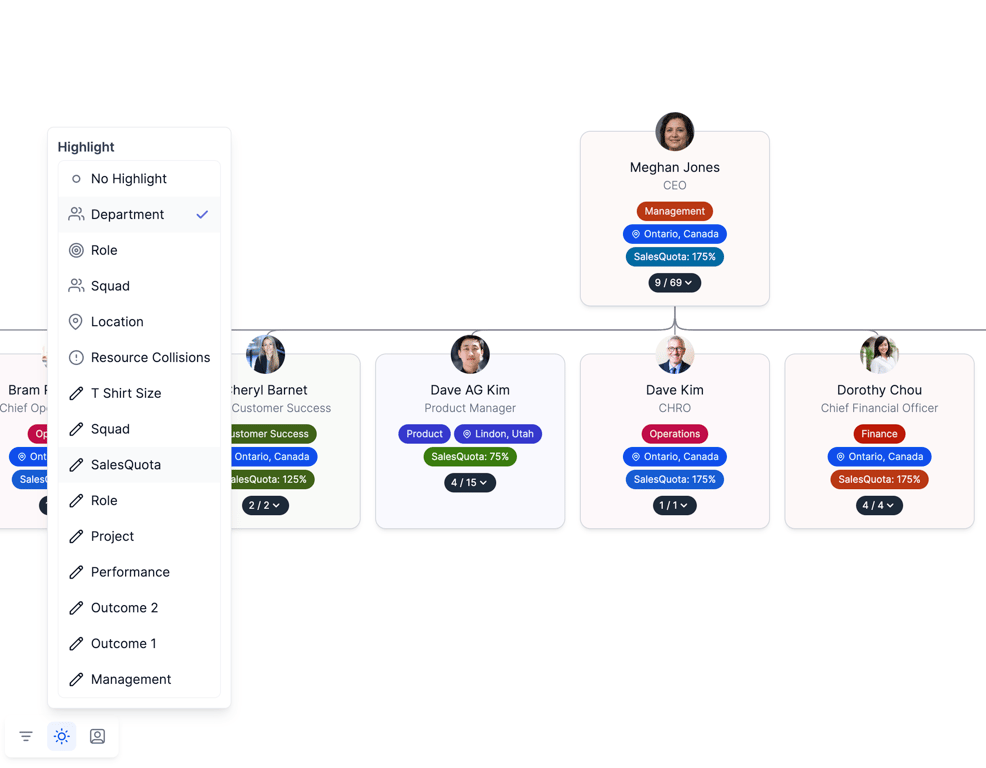
I can also filter by employees with a sales quota by hitting the light icon in the middle of the panel at the bottom left of the screen.
-
Another action I can do in the Sales Quota filter is select different percentages or units to see who is above (or under) quota.
